

For context, also read our previous daily analysis, Gold Price Analysis: 3 Critical Levels After a Powerful Breakout Above $4,000, and our study of Nvidia stock at channel support.
This gold and Nasdaq outlook comes a few hours before the October CPI report. Spot gold closed Monday near $4,139, up about 1.7%, and traded near $4,128 early Tuesday. The Nasdaq 100 rebounded 3.4% on Monday to close at 27,907.63, after its worst session since 2020 last Thursday. Oil fell sharply, the dollar weakened and the 10-year yield held near 4.86%. The one thing that matters most today: CPI at 8:30 a.m. ET. Consensus is +0.3% m/m headline and +0.2% core, per TipRanks. With a December hike already heavily priced, a hot print would hit both instruments.
Gold and Nasdaq Outlook: Gold Structure and Key Levels
Elliott Wave Context
We treat the October 30 low near $3,870 as the end of wave 4, a falling wedge read as an ending diagonal. The rally to $4,147 on November 5 is labeled wave (1) of a new impulse. Friday’s pullback held at $4,026, well above $4,000, which gives us the higher low we asked for last week and fits a wave (2). Monday’s advance is the early part of a possible wave (3). That count stays valid while price holds above $4,026.
Price Action
Monday’s range was roughly $4,055 to $4,148, with a close near the high. Price is now back at the November 5 high, so $4,145–$4,150 is a potential double top. A clean break would be a strong sign of wave (3) momentum. A second rejection there would be a warning.
Key Levels
Resistance: $4,145–$4,150, then $4,200 (descending trendline), then $4,250. Support: $4,080–$4,088, then $4,026–$4,051, then $4,000.
Bullish Scenario
If gold closes above $4,150, the structure points to $4,200, then $4,250. Invalidation: a daily close below $4,026.
Bearish Scenario
If gold rejects $4,145–$4,150 and closes below $4,080, the structure points to $4,051, then $4,000–$4,026. Invalidation: a daily close above $4,150.
Nasdaq 100: Wave C Overshoots, Then a Sharp Rebound
Elliott Wave Context
We count the decline from the 31,360 record on October 6 as an A-B-C correction. Wave C overshot the C equals A projection near 27,300 and reached 26,606 on November 5, when the index fell about 6.4% on AI data-center worries after the midterms. Monday’s 3.4% rally from above the 26,888 Friday low is the first sign wave C may be complete. That needs confirmation: a close back above 28,085, where the breakdown began.
Price Action
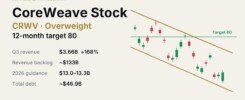
Monday’s range was 27,228 to 28,026, and the close sat near the top of it. Semiconductors led, while Nvidia fell 4.3% to $178.67 after its board opened an independent investigation. Nasdaq 100 futures were roughly flat overnight. CoreWeave reports after the close, Cisco and Applied Materials on Thursday, and Nvidia on November 17.
Key Levels (cash NDX)
Resistance: 28,026–28,085, then 28,437, then 28,830. Support: 27,228, then 26,888, then 26,606.
Bullish Scenario
If the index closes above 28,085, the structure points to 28,437, then 28,830, and supports a completed wave C. Invalidation: a daily close below 27,228.
Bearish Scenario
If the index closes below 27,228, Monday’s rebound fails and the structure points to 26,888, then 26,606. A break there would mean wave C is extending. Invalidation: a daily close above 28,085.
Macro: Yields, Dollar, Fed Odds and the Calendar
Yields and the Dollar
The 10-year Treasury yield traded near 4.86% and the 2-year near 4.55% on Monday. The dollar index fell about 0.3% toward 101.88, according to Kitco. Brent fell almost 6% to $92.57 after comments that further military action against Iran is not needed for now.
Fed Pricing
Rate futures price roughly an 80%–82% chance of a 25 basis point hike at the December 8–9 FOMC meeting, up from about 71% before Friday’s strong payrolls report (+165,000).
Calendar
Today: October CPI at 8:30 a.m. ET and a 10-year Treasury auction at 1:00 p.m. ET. Wednesday is Veterans Day, with bond markets closed and stocks open. Thursday: jobless claims and existing home sales. Friday: October PPI at 8:30 a.m. ET.
Follow-Up on Previous Setups
Gold, November 5 (published near $4,065): Bullish scenario fired, first target hit, second partly reached
The trigger, a daily close above $4,085, fired on Thursday by a narrow margin (close near $4,086 on our data feed). The first target, $4,104–$4,115, was hit the same day with a high near $4,147. The lower edge of the second target, $4,145, was touched on Thursday and again on Monday. $4,200 has not been reached. The $3,970 invalidation was never threatened.
Nasdaq 100, November 5 (published near 28,437): Bearish scenario fired, both targets hit
The bearish trigger, a close below 28,085, fired on Thursday with a close near 26,630. Both targets, 27,967 and 27,645, were hit and exceeded by roughly 1,000 points. The bullish case was invalidated the same day.
Nvidia, November 7 (published near $188.70): Under pressure
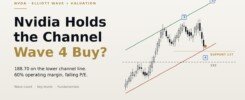
NVDA closed Monday at $178.67, below the channel line and just above the 177 support named in that piece. The setup is not invalidated yet, but it is weaker, and a decisive break of 177 would put it in question.
Summary
XAUUSD near $4,128:
🟢 Bullish above $4,150, toward $4,200 and then $4,250
⚠️ Neutral between $4,026 and $4,150
🔴 Bullish count invalidated below $4,026, opening $4,000 and then $3,970
Nasdaq 100 near 27,908 (cash close):
🟢 Bullish above 28,085, toward 28,437 and then 28,830
⚠️ Neutral between 27,228 and 28,085
🔴 Rebound invalidated below 27,228, opening 26,888 and then 26,606
CPI can push both instruments through these levels within minutes, and daily ranges in the Nasdaq 100 remain unusually wide after last week’s 6% drop. Treat every level here as a probability, not a certainty.
Full Elliott Wave counts and the ICT and Elliott Wave market scanner are available in ImpulseAlpha All-Access → impulsealpha.com/setup/
—
Disclaimer: ImpulseAlpha is an independent software tool and is NOT a broker, financial advisor, or associated with any asset management corporation. This analysis is for educational purposes only and does not constitute financial, investment or trading advice. Trading involves significant risk.