


CoreWeave stock closed Tuesday at 48.73, down about 65% from its 52-week high of 138.25. After the close, CoreWeave reported a breakout third quarter: revenue up 168% to $3.66 billion, a ~$133 billion backlog and a raised full-year outlook. Pre-market trading points to a gap higher toward 56.
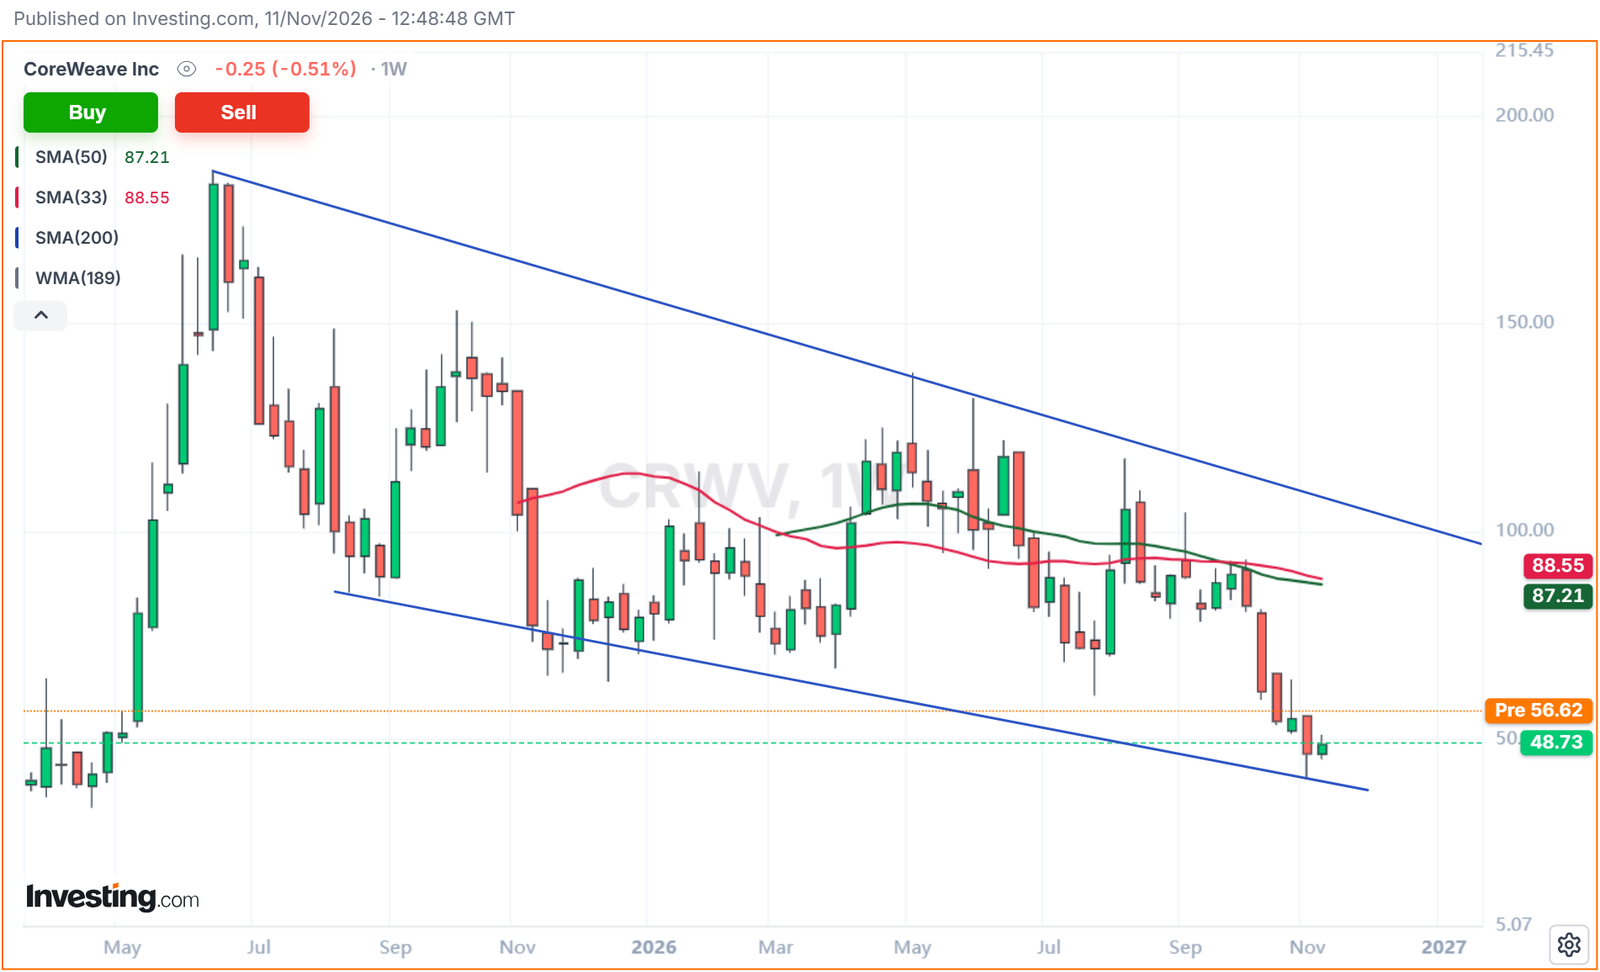
ImpulseAlpha research rates CRWV Overweight with a 12-month target of 80, about 64% above Tuesday’s close. The business is scaling faster than the debt is growing, and the chart is sitting on the lower line of a 17-month falling channel. The setup is invalidated on a weekly close below 40.
Check CoreWeave’s numbers yourself: live chart, SEC fundamentals and a valuation model with your own assumptions.
CoreWeave Stock Rating at a Glance
| Rating | Overweight |
| 12-month target | 80 |
| Last close (Nov 10) | 48.73 |
| Upside to target | ~64% |
| Invalidation | Weekly close below 40 |
CoreWeave Stock Chart: The Channel Floor Holds
Since the mid-2025 peak, CRWV has traded inside a falling channel. Last week the stock touched the lower line with a low of 40.58 and closed the week back above it. The 33-week SMA (88.55) and 50-week SMA (87.21) have rolled over and now sit as resistance near 87–88. The upper channel line is close to 97.
Our target of 80 sits below that moving-average cluster on purpose. It needs a move back to the middle of the channel, not a breakout.
CoreWeave Fundamentals: Q3 2026 in Numbers
| Metric | Q3 2026 |
|---|---|
| Revenue | $3.66B (+168% YoY) |
| Adjusted EBITDA | $2.3B (62% margin) |
| Adjusted operating margin | 10% (5% in Q2, 1% in Q1) |
| GAAP net loss | $709M |
| Revenue backlog | ~$133B (+138% YoY) |
| FY2026 revenue guidance | $13.0–13.3B (raised) |
| Exit-2026 run-rate target | $20–21B |
| Active power | 1.7+ GW (doubled in 2026) |
The annual picture shows how fast the company has scaled, and how it was funded:
| Fiscal year | Revenue | Net loss | Total debt |
|---|---|---|---|
| FY2023 | $0.23B | −$0.59B | $2.0B |
| FY2024 | $1.92B | −$0.86B | $10.6B |
| FY2025 | $5.13B | −$1.17B | $29.8B |
Source: CoreWeave 10-K filings and the Q3 2026 earnings call.
Why Overweight: 3 Reasons
1. The backlog is five times the market cap
At about $27B, CoreWeave’s market value is roughly a fifth of its ~$133B contracted backlog. Management describes demand as far ahead of available capacity through 2027.
2. Operating leverage has arrived
The adjusted operating margin went from 1% to 5% to 10% in three quarters, a quarter ahead of plan. Adjusted operating income nearly tripled from Q2, while interest expense rose about a third.
3. Price is at the channel floor
The stock is at the bottom of its long-term range after a 65% drawdown. Investors buying here know exactly where they are wrong: a weekly close below 40.
The Risks
Debt and Interest
Total debt is about $46.9B, with cash of $4.1B at quarter end. Q4 interest expense is guided at $1.05–1.15B. Funding conditions can turn quickly.
CapEx and Dilution
Full-year CapEx guidance is $37–39B. If credit markets tighten, new equity issuance is a real possibility.
Profitability Timeline
CoreWeave is still losing money on a GAAP basis. Management expects adjusted net income to turn positive only in the first half of 2028.
CoreWeave Stock Key Levels
Support: 40–41
The November low and the lower channel line.
First Resistance: 56–64
The post-earnings gap area and the late-October swing high.
Target: 80
The middle of the channel, below the 87–88 SMA cluster.
Invalidation: Weekly Close Below 40
A close below the channel floor breaks the setup.
CoreWeave Stock Summary
CRWV at 48.73:
🟢 Overweight, 12-month target 80, while the stock holds above 40
⚠️ 56–64 is the first test after the earnings gap
🔴 Invalidated on a weekly close below 40
Get the full CoreWeave research report
ImpulseAlpha All-Access · €69 / month or €399 / year
The CRWV report covers the income statement, balance sheet, backlog and power KPIs, the earnings call, valuation vs. consensus, and the bull vs. bear case. It sits in the research library next to NVDA, TSLA, AMD, MU, PLTR and more.
Get All-Access and the Research Library →
Only need the valuation model? Stock Dashboard Pro is €19/month →
—
Disclaimer: ImpulseAlpha is an independent software tool and is NOT a broker, financial advisor, or associated with any asset management corporation. This analysis is for educational purposes only and does not constitute financial, investment or trading advice. Trading involves significant risk.
