


Update, November 20: the 148.80 low is broken
NVDA closed Thursday at 145.98, below the post-resignation low of 148.80, and is trading near 139.50 on Friday. Unless it recovers above 152 by today’s close, the weekly close will put the long-term bull count under review, as outlined below. The next support zone is the rising channel floor in the low 140s to mid 130s. The fundamentals have not changed: this is now a test of price, not of the business.
Nvidia earnings beat on every line that matters. Revenue for the third quarter of fiscal 2027 came in at $115.8 billion against roughly $109 billion expected, EPS was $2.68 against $2.47, and the fourth-quarter guide of about $130 billion was well above the $125 billion Wall Street had penciled in. The board added a $150 billion buyback on top.
The stock still fell. NVDA rose about 3.6% after hours on Tuesday, opened Wednesday near 159, and then sold off all day to close at 150.96, down 2.9% and below the 152 line we flagged in our weekend preview. Here is what the market is pricing, and what to watch into Friday’s weekly close.
Early Black Friday: a full year of All-Access for €139 instead of €399. Includes our new NVDA post-earnings research report, the valuation model and the Options Probability Screen. Until Tuesday, November 24.
Nvidia Earnings: The Numbers
| Metric | Q3 FY2027 | Expected |
|---|---|---|
| Revenue | $115.8B (+103% YoY) | ~$109.1B |
| Data Center revenue | $107.6B (+110% YoY) | ~$101.9B |
| Adjusted EPS | $2.68 | $2.47 |
| GAAP gross margin | 74.8% | ~74.0% (guide) |
| Q4 revenue guide | $130B ±3% | ~$125.3B |
| Buyback | $150B authorization | |
The Q4 guide assumes no data center compute revenue from China. Sources: Nvidia’s results release and Yahoo Finance consensus data.
4 Critical Reasons Nvidia Stock Fell Anyway
1. Leadership is still an open question
This was the first report without Jensen Huang, and the board has not named a permanent CEO. Strong numbers answer the question of whether the business is intact. They do not answer who runs it in 2027.
2. China is now zero in the guide
The $130B guide assumes no data center compute revenue from China. That is conservative, but it also means one of the larger long-term markets is out of the model entirely, while a short seller report claims China drove a much bigger share of sales than reported.
3. Customer financing is under the microscope
Analysts going into the print flagged Nvidia’s financing arrangements with AI customers as the key issue. Investors want to know how much of the demand is funded by Nvidia’s own balance sheet.
4. The trade was crowded into the print
Options priced a move of about 7–8% in either direction, more than double the usual post-earnings move. When a stock has fallen six weeks in a row and the numbers are already expected to be strong, a beat is often used to sell rather than to buy.
What the ImpulseAlpha Valuation Model Says
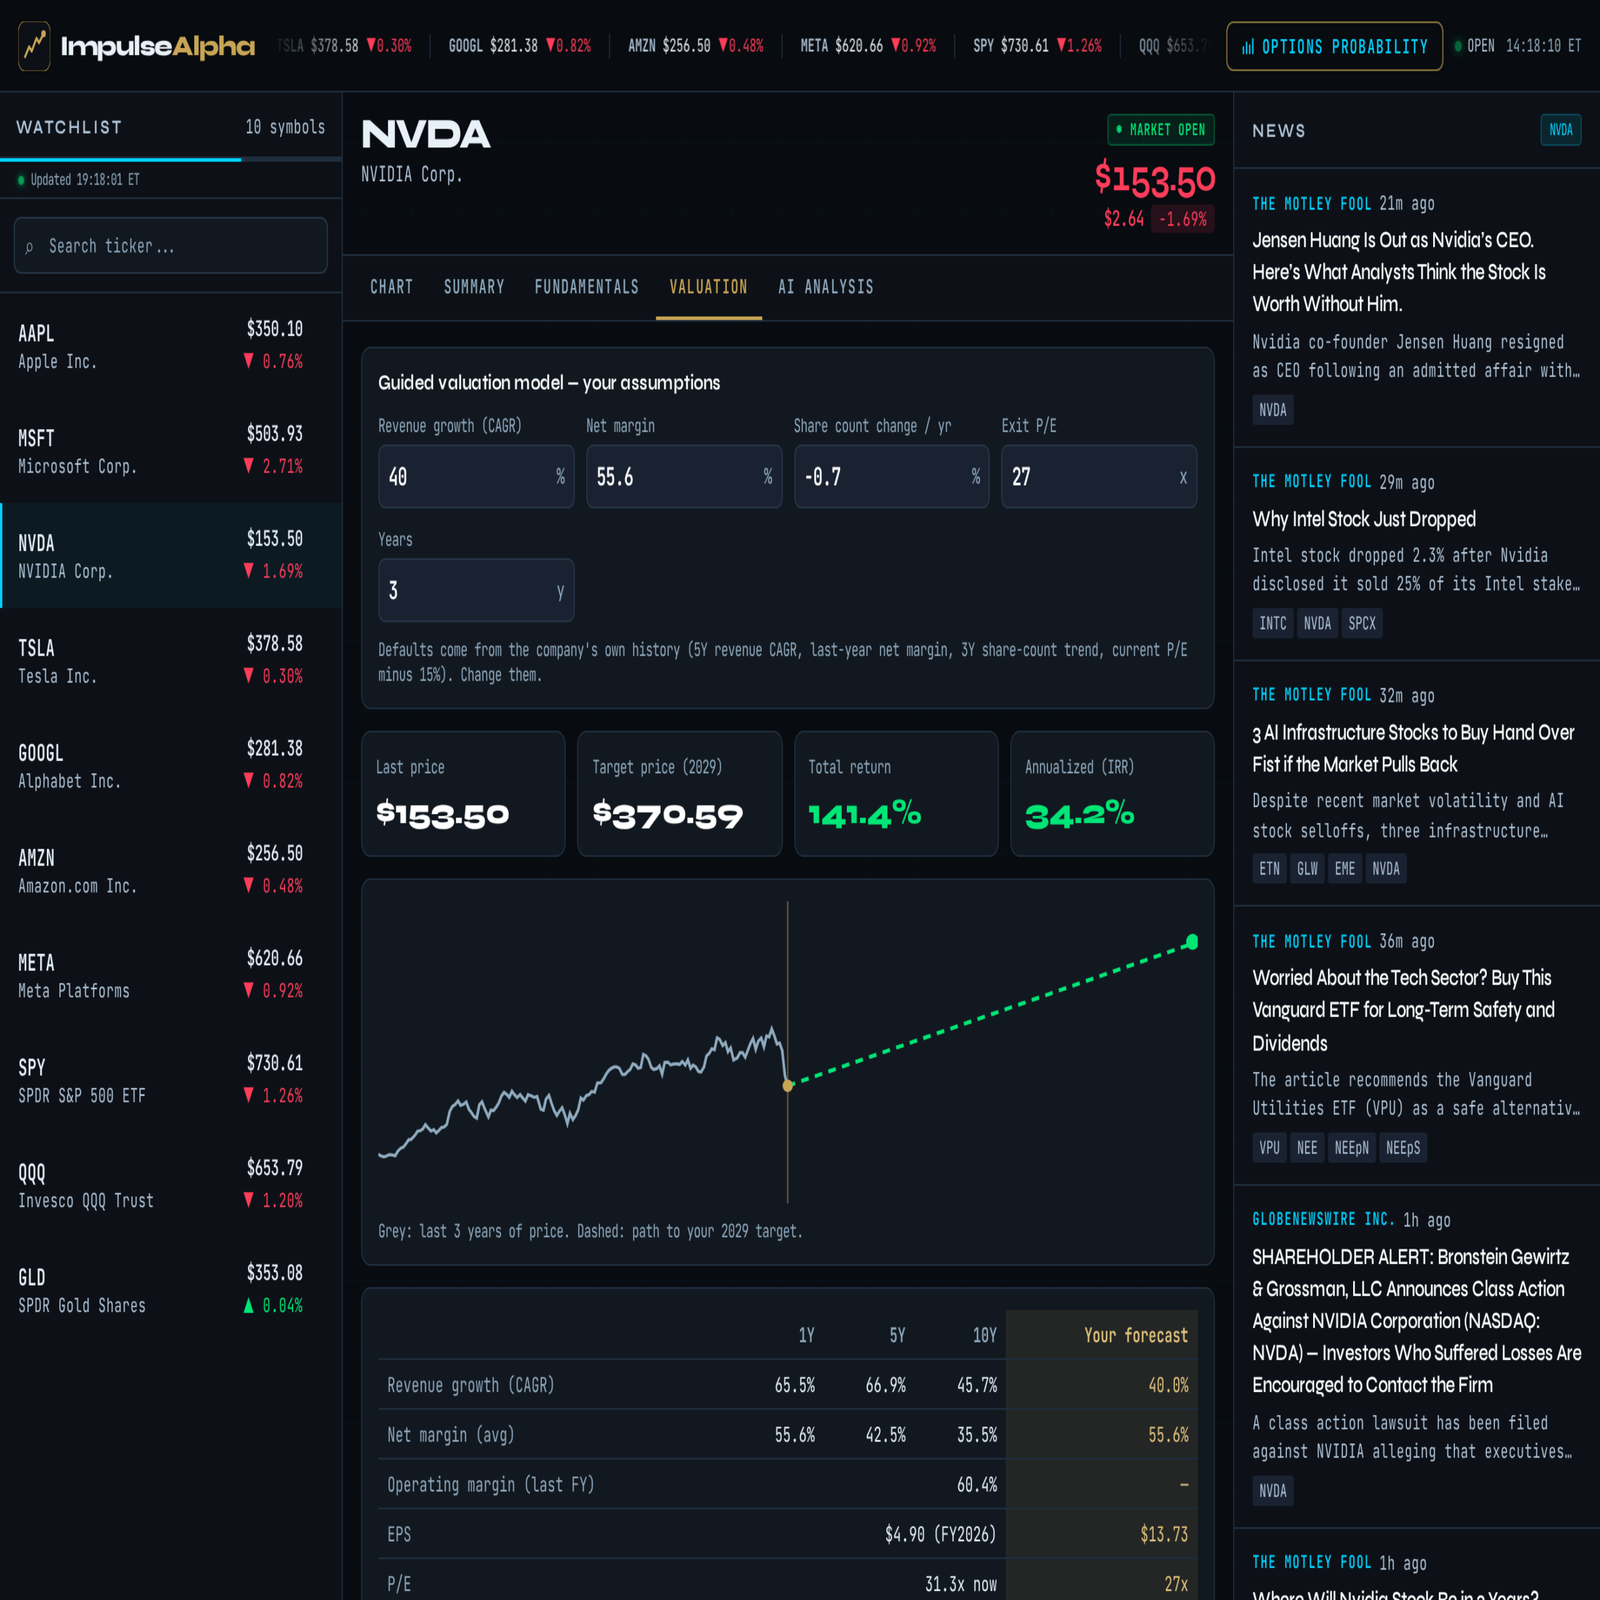
Using assumptions below Nvidia’s own history (40% annual revenue growth vs. a 5-year average of about 67%, a 55.6% net margin and an exit P/E of 27x, below today’s level), our Stock Dashboard model put the 2029 target near 370 when NVDA traded at 153.50. That is an implied return of roughly 34% a year. At 150.96, the math is slightly better, not worse.
Nvidia Stock Key Levels After Earnings
152: lost on a daily close
The 2024 highs and the line for the long-term bull count. NVDA closed below it on Wednesday at 150.96. One daily close is a warning; the weekly close on Friday decides.
148.80: the post-resignation low
A break below it would open a deeper correction.
159–160: the post-earnings high
Wednesday’s open and high. A move back above it would mark the selloff as a failed breakdown.
177: repair
The old base. A daily close above it is still the first real sign that the trend has turned.
Nvidia Earnings Summary
NVDA at 150.96 after a beat and raise:
🟢 Back above 160 = failed breakdown, 177 the next test
⚠️ 148.80–160 = range while leadership and China questions play out
🔴 A weekly close below 152, and especially below 148.80, puts the long-term count under review
The business delivered. The stock is now a test of whether the market prices Nvidia on its numbers or on its headlines.
Read our new NVDA post-earnings research report
Early Black Friday · All-Access €139 for the first year · €399
The full post-earnings report, the valuation model for any US stock, the Options Probability Screen and the Elliott Wave and ICT scanners. One plan, everything included.
Not ready? Get our pre-earnings NVDA report free →
—
Disclaimer: ImpulseAlpha is an independent software tool and is NOT a broker, financial advisor, or associated with any asset management corporation, and is not affiliated with FTMO. This analysis is for educational purposes only and does not constitute financial, investment or trading advice. Trading involves significant risk.