

For context, also read our previous daily analysis, Gold Price Analysis: 3 Critical Levels After a Brutal Break Below $4,000, and the earlier Gold and Nasdaq Outlook: 3 Critical Levels Before a Powerful CPI Test.
This gold and Nasdaq outlook comes after a heavy start to the week for both instruments. Spot gold trades near $3,870 in Tuesday’s Asian session after falling to $3,832 on Monday, its lowest level in about a year. The Nasdaq 100 fell 2.67% on Monday to close at 27,197, its third straight losing session, while index futures are up roughly 0.3% overnight. The one thing that matters most today: Nvidia reports after the US close, and with the 10-year yield above 5% the reaction can move the Nasdaq through key levels in either direction.
Gold and Nasdaq Outlook: Gold Structure After the One-Year Low
Elliott Wave Context
Our primary count since last Thursday treated the rally from about $3,870 to $4,148 as a three-wave correction inside a larger decline from the January record near $5,598. Monday’s break below $3,870 confirmed that reading and invalidated the alternate wave 2 count. The drop from $4,148 now looks impulsive. The $3,832 low may complete a minor fifth wave, which would allow a corrective bounce, but the larger trend stays down while price holds below the $3,930 area.
Price Action
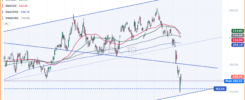
Gold closed Monday near $3,855 after a sweep of liquidity at $3,832. The 2-hour chart shows price testing resistance near $3,889, with the moving averages overhead near $3,915 and $3,959. Analysts at FX Leaders and Mitrade both mark the $3,832–$3,855 zone as the floor bulls need to defend.
Key Levels
Resistance: $3,889, then $3,920–$3,930, then $3,959 and $4,000. Support: $3,855, then $3,832 (Monday’s low), then the $3,800 round number.
Bearish Scenario
If gold fails below $3,930 and closes below $3,832, the structure points to $3,800 and possibly lower, as the impulsive decline extends. Invalidation: a daily close above $3,930.
Bullish Scenario
If gold closes above $3,930, the $3,832 low gains weight as a short-term bottom and the structure points to $3,959, then $4,000. Invalidation: a daily close below $3,832.
Nasdaq 100: Rebound Fails Below the 200-Day Average
Elliott Wave Context
We count the decline from the 31,360 record as a larger correction. The November 5 low at 26,606 ended wave A, and the rebound to about 28,594 on November 11 stalled below the 200-day average near 28,535. That fits wave B. The three-day drop to 27,197 suggests wave C is now in progress. A new advance above 28,594 is needed to reopen the bullish case.
Price Action
Monday’s cash range was roughly 27,150 to 27,620, and the index closed near the low. Chip stocks fell more than 5% on new US limits on AI chip sales to China. The index has already given back more than 61.8% of the November rebound, a sign of weak buying pressure.
Key Levels (cash NDX)
Resistance: 27,620 (Monday’s high), then 27,945–27,960, then 28,535–28,555. Support: 27,093, then 27,000, then 26,606 (November low) and the 26,450 zone.
Bearish Scenario
If the index closes below 27,093, the structure points to 27,000, then 26,606. A break below 26,606 would confirm wave C is extending. Invalidation: a daily close above 27,620.
Bullish Scenario
If Nvidia’s results lift the index to a close above 27,620, the structure points to 27,960, then 28,535. Invalidation: a daily close below 27,093.
Macro: Yields, Dollar, Fed Odds and the Calendar
Yields and the Dollar
The 10-year Treasury yield eased to about 5.12% on Monday after closing at 5.15% on Friday. The dollar index trades near 103.4–103.5, close to a 19-month high, which keeps pressure on gold.
Fed Pricing
CME FedWatch shows about 91% odds of a 25 basis point hike at the December 8–9 FOMC meeting and about 9% odds of a 50 basis point move, as reported by FXStreet and Reuters.
Calendar
Today: October retail sales at 8:30 a.m. ET, Home Depot earnings, and Nvidia earnings after the close. Wednesday: minutes of the October FOMC meeting at 2:00 p.m. ET and a large AI IPO that markets are watching closely.
Follow-Up on Previous Setups
Gold, November 12 (published near $3,995): Bearish scenario fired, both targets hit
The bearish trigger, a close below $3,969, fired on Thursday when gold fell below $3,900. The first target, $3,919, was hit the same day. The second target, $3,870–$3,879, was hit on Friday, and Monday extended the drop to $3,832. The bullish trigger at $4,051 never fired. The alternate bullish count was invalidated below $3,870.
Nasdaq 100, November 12 (published near 28,374): Bullish setup failed, bearish scenario fired, both targets hit
The bullish trigger, a close above 28,594, never fired. Friday’s close near 27,960 was below the 28,085 trigger, so the breakout failed. Monday’s close at 27,197 hit both targets, 27,421 and 27,228, and invalidated the bullish case below 27,421.
Summary
XAUUSD near $3,870:
🟢 Bullish above $3,930, toward $3,959 and then $4,000
⚠️ Neutral between $3,832 and $3,930
🔴 Bearish below $3,832, toward $3,800; bullish case invalidated
Nasdaq 100 near 27,197 (cash close), futures higher overnight:
🟢 Bullish above 27,620, toward 27,960 and then 28,535
⚠️ Neutral between 27,093 and 27,620
🔴 Bearish below 27,093, toward 27,000 and then 26,606
Nvidia’s earnings, retail sales and 5% yields can push both instruments through these levels quickly, and after-hours moves can create gaps at the next open. Treat every level here as a probability, not a certainty. For a wider view of the Nasdaq structure, see the OANDA chart of the week.
Full Elliott Wave counts and the ICT and Elliott Wave market scanner are available in ImpulseAlpha All-Access → impulsealpha.com/setup/
—
Disclaimer: ImpulseAlpha is an independent software tool and is NOT a broker, financial advisor, or associated with any asset management corporation. This analysis is for educational purposes only and does not constitute financial, investment or trading advice. Trading involves significant risk.