


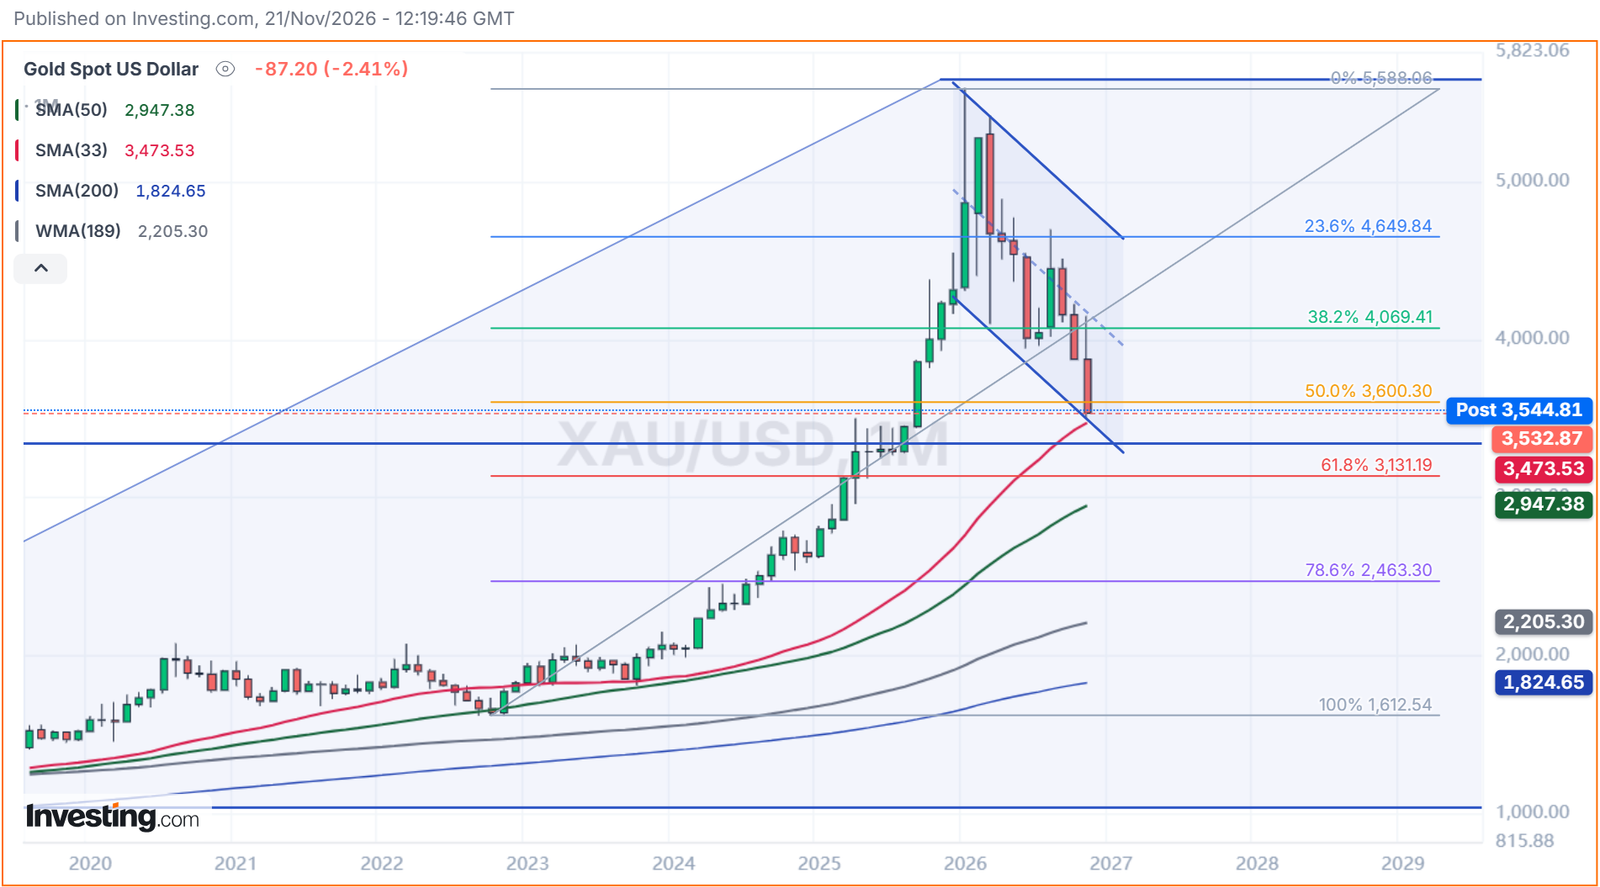
Gold price forecast for the weeks ahead starts with one number: 61.8%. XAUUSD closed the week near 3,545, down 2.4% on Friday and about 36% below its 2026 record high of 5,588. That puts gold below the 50% retracement of its entire 2023–2026 rally and closing in on the 61.8% Fibonacci level at 3,131, the zone where large corrections in strong trends most often end.
Our view: the selloff has formed a clear downside channel, and the 3,130–3,550 area is where we expect gold to turn. Here are the three signs that support that call, and the levels that would prove it wrong.
Black Friday: ImpulseAlpha All-Access for €139 the first year (was €399), until Tuesday, November 24. Elliott Wave and ICT scanners for gold, indices, FX and crypto, the Terminal, the Stock Dashboard and the full research library. First 50 members: renewal locked at €195/year + a free FTMO Challenge account.
Gold Price Forecast: Where the Correction Stands
| Fibonacci level (2023–2026 rally) | Price | Status |
|---|---|---|
| 0% (2026 high) | 5,588.06 | Top |
| 23.6% | 4,649.84 | Broken |
| 38.2% | 4,069.41 | Broken |
| 50.0% | 3,600.30 | Broken, now resistance |
| 61.8% | 3,131.19 | Next support, key level |
| 78.6% | 2,463.30 | Only if 61.8% fails |
| 100% (2023 low) | 1,612.54 | Start of the rally |
At about 3,545, gold has retraced roughly 51% of the move from 1,612 to 5,588. The rally added almost 4,000 points in three years. A correction that gives back half to two-thirds of it is normal, not a sign the bull market is over.
3 Critical Signs Gold Is Near a Reversal
1. The 61.8% Fibonacci retracement is close
The 61.8% level at 3,131 is the classic end zone for a deep correction inside a long-term uptrend. In Elliott Wave terms, the 2023–2026 advance is a completed impulse, and the decline from 5,588 is the corrective phase that follows it. Corrections of that size usually stop between the 50% and 61.8% retracements. Gold is now inside that window.
2. A clean downside channel has formed
Since the 2026 high, gold has fallen inside a well-defined falling channel, and this month’s candle has reached its lower boundary. Corrections that move in orderly channels tend to end at the channel floor, and a break above the upper line is the classic signal that the correction is complete.
3. Long-term moving average support
The 33-month SMA sits at 3,473, right under the current price. It has tracked the whole 2023–2026 trend from below and was never tested during the rally. Just below it, the 3,400–3,500 area was the 2025 consolidation zone that gold broke out of before the final leg higher. Old resistance turned support, the moving average and the channel floor all cluster in the same area.
Gold Price Key Levels
Resistance: 3,600 (50%)
A monthly close back above 3,600 would be the first sign that the low is in.
Support zone: 3,473–3,530
The 33-month SMA and the lower channel line. The first place buyers should show up.
Key support: 3,131 (61.8%)
The line in the sand for the reversal view. Gold can probe it intraday, but it should hold on a monthly close.
Breakdown: below 3,131
A monthly close under 61.8% would open the 50-month SMA near 2,947 and then the 78.6% retracement at 2,463.
Gold Price Scenarios
Reversal (our main view)
Gold holds 3,131–3,530 and builds a base. A monthly close above 3,600 and then a break of the channel’s upper line would point to 4,069 (38.2%) first and 4,650 (23.6%) next.
Extended base
Gold chops between 3,131 and 3,600 for a few months while the channel narrows, before turning higher.
Breakdown
A monthly close below 3,131 puts the reversal view on hold, with 2,947 and 2,463 as the next supports.
Gold Price Forecast Summary
XAUUSD at about 3,545, 51% retraced:
🟢 Holds 3,131 and closes above 3,600 = reversal, 4,069 then 4,650
⚠️ 3,131–3,600 = base building at the channel floor
🔴 Monthly close below 3,131 = deeper correction toward 2,947 and 2,463
The trend that took gold from 1,612 to 5,588 is still intact on the monthly chart. The correction is deep, but it is arriving exactly where corrections of this kind usually end.
Trade the gold reversal with the full ImpulseAlpha toolkit
Black Friday · All-Access €139 for the first year · €399
Everything we built, in one plan:
- Elliott Wave and ICT scanners: automated wave counts and smart money structure on XAUUSD, NQ, SPX, FX and crypto
- ImpulseAlpha Terminal + live dashboards: real-time quotes and news for gold, silver, oil, forex, indices, crypto and US stocks
- Telegram signals and WhatsApp alerts: setups with entry, stop and target
- Stock Dashboard Pro: 11 years of SEC data, valuation model with target price and IRR, AI analysis of any US stock
- Research library: institutional-style reports on NVDA, ANT, TSLA, MELI, AMD, PLTR and more
- Options Probability Screen: where the options market prices a stock at expiry
First 50: renewal locked at €195/year + free FTMO Challenge · until Tuesday, Nov 24 · 30-day money-back guarantee · See all tools →
—
Disclaimer: ImpulseAlpha is an independent software tool and is NOT a broker, financial advisor, or associated with any asset management corporation, and is not affiliated with FTMO. This analysis is for educational purposes only and does not constitute financial, investment or trading advice. Trading involves significant risk.