


⚠️ Update, November 13: the setup broke after Jensen Huang’s resignation
Nvidia’s CEO Jensen Huang resigned on November 12, with CFO Colette Kress named interim CEO. The stock opened down as much as 14% and hit 148.80 intraday, before closing at 166.19. On Friday it trades near 163.
What that means for this analysis: the 177–190 buy zone failed. Price closed below 177, which we flagged in advance as the warning level for a deeper wave 4. The intraday low dipped below 152, our invalidation line, but the stock closed back above it. The rule stays the same: a weekly close below 152 puts the bull count under review. A weekly close back above 177 would be the first sign of repair.
The business numbers below have not changed. What changed is leadership risk, and how much the market is willing to pay for it.
Free this week: our full NVDA research report. Data center growth, 60% margins, the CUDA moat, valuation vs. consensus, 12-month target and the bull vs. bear case.
Original analysis, November 7:
Nvidia stock has fallen more than 20% from its 243 record high and closed the week at 186.64. That pullback has taken the price straight to the lower boundary of the rising channel that has guided NVDA since the 2023 breakout. The selloff has also pushed the valuation to its lowest level in years: on forward earnings, Nvidia now trades below the S&P 500.
A strong technical support and a compressed multiple are lining up at the same time. Our read: this is a wave 4 correction finishing at channel support, and a buying opportunity with a clear invalidation level below.
Check Nvidia’s numbers yourself: live chart, 11 years of SEC fundamentals and a valuation model.
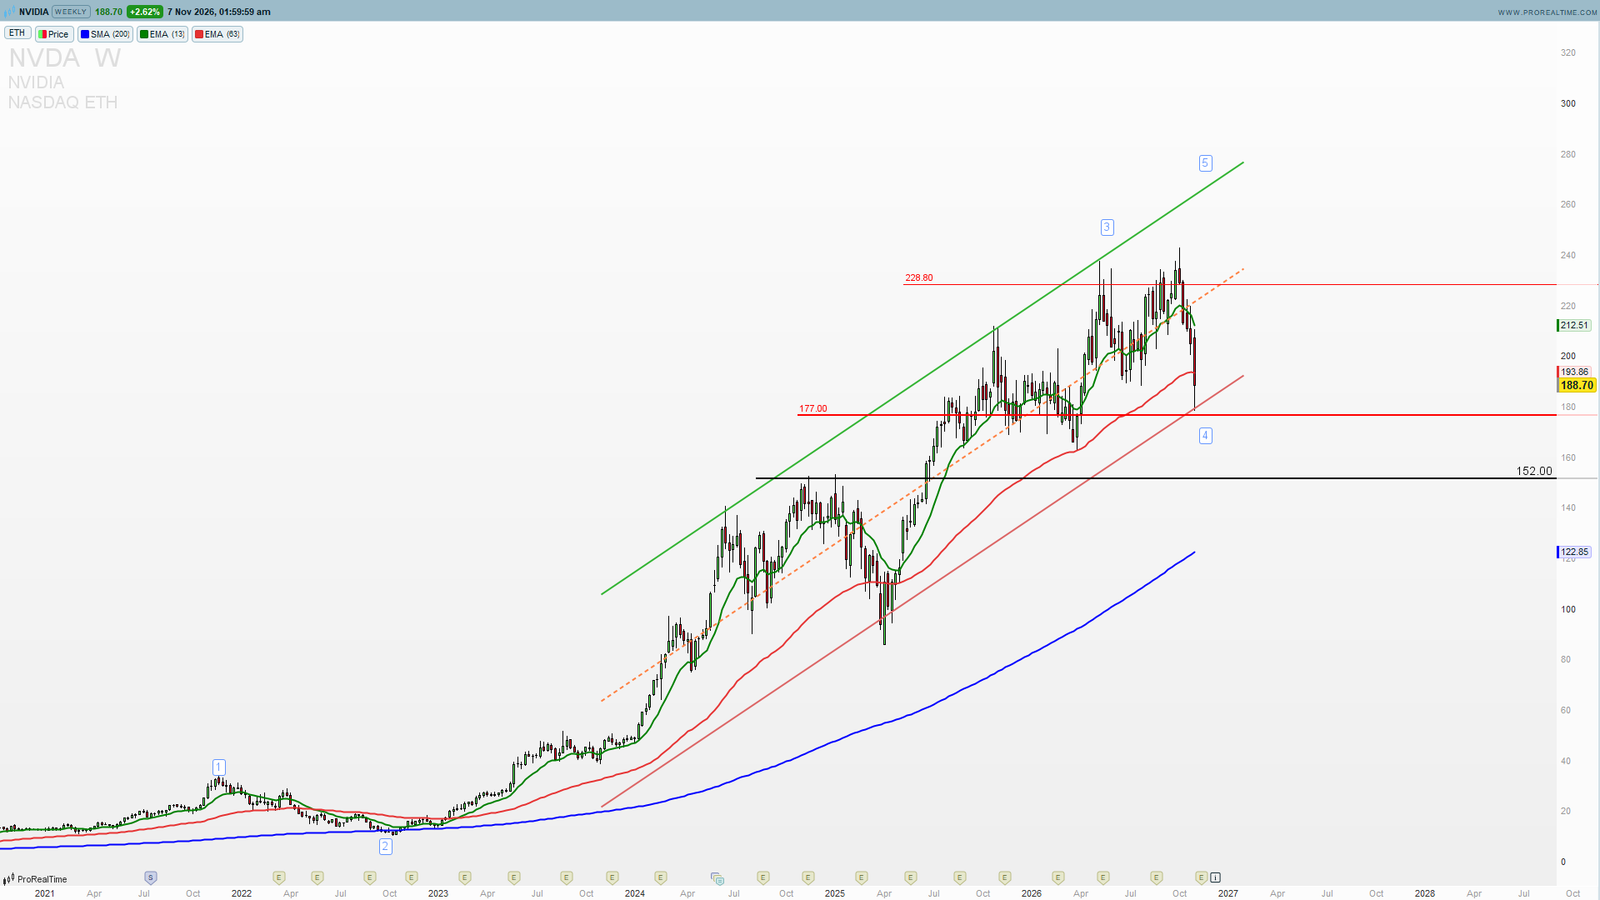
Nvidia Stock Chart: The Rising Channel Holds
The Channel
The upper line of the channel connects the 2024 highs with the 2026 peaks and now runs near 270–280. The lower line connects the April 2025 low with the 2026 swing lows and now sits around 182–186. This week’s low touched that line, and the candle closed well off the low. Every test of this line since 2025 has produced a rally.
Horizontal Support at 177
Just below the channel line is the 177 zone. That is the base of the 2025–2026 consolidation, and it was resistance before it turned into support. The channel line and 177 together form a support band of 177–186.
Moving Averages
On the weekly chart, the price has slipped below the 63-week EMA at 193.86 and the 13-week EMA at 212.51. A weekly close back above 194 is the first sign that the correction has ended. The 200-week SMA is far below at 122.85 and still rising steeply, so the long-term trend is intact.
Momentum
The monthly RSI has cooled to about 56, from overbought readings in 2024. Momentum has reset without breaking the trend, which is how a healthy wave 4 behaves.
Elliott Wave Count: Wave 4 Near Its End
We count the move from the 2022 low as an impulse. Wave 3 peaked near 238 in spring 2026. Since then, NVDA has traded sideways to lower in a choppy, overlapping structure, which is typical of a fourth wave. The final leg down of this correction has now reached the lower channel line.
If the count is right, wave 5 should take Nvidia back to the upper channel line, which projects to the 270–280 area during 2027. Wave 4 has not overlapped the wave 1 territory, so the impulse count remains valid. A weekly close below 177 would point to a deeper, more complex wave 4. A close below 152, the 2024 highs, would put the count under review.
Nvidia Fundamentals: Growth Has Not Slowed
The chart has corrected, but the business has not. These are Nvidia’s full fiscal years, straight from its 10-K filings with the SEC (fiscal year ends in late January):
| Fiscal year | Revenue | Operating margin | Net income | EPS | Free cash flow |
|---|---|---|---|---|---|
| FY2023 | $27.0B | 15.7% | $4.4B | $0.17 | $3.8B |
| FY2024 | $60.9B | 54.1% | $29.8B | $1.19 | $27.0B |
| FY2025 | $130.5B | 62.4% | $72.9B | $2.94 | $60.9B |
| FY2026 | $215.9B | 60.4% | $120.1B | $4.90 | $96.7B |
Revenue Up 8x in Three Years
Revenue grew from $27B to $216B between fiscal 2023 and fiscal 2026. Even at that size, fiscal 2026 still grew 65%.
A 60% Operating Margin
Nvidia keeps about 60 cents of operating profit from every dollar of sales. That is a sign of real pricing power: data center customers pay for the GPUs, the networking and the CUDA software platform that ties them together.
Cash Returned to Shareholders
Free cash flow reached $96.7B in fiscal 2026, and Nvidia spent $40.1B on buybacks. The diluted share count has fallen from 25.1B to 24.5B in three years, so each share owns a bigger slice of the profits.
Nvidia Valuation: Cheaper Than the Market
Earnings have grown much faster than the stock price, so the multiple has done the correcting. At current prices, Nvidia trades at about 26x trailing earnings and roughly 12–17x forward earnings, depending on the estimate used, according to GuruFocus and GnG Research. That is below the S&P 500’s forward multiple, for a company with a 60% operating margin and double-digit growth.
A low forward P/E only matters if the estimates hold. The market is pricing in a slowdown in AI spending. The test for investors is simple: what growth and margin do you need to assume to justify 186.64? If you can reach a solid return with conservative assumptions, the price offers a margin of safety.
The Risks
AI Capex Cycle
Nvidia’s revenue depends on a handful of hyperscalers. If they cut data center budgets, estimates will come down, and a cheap forward P/E can turn into a value trap.
Competition and Export Controls
Custom chips from the largest cloud providers and US export restrictions on China can pressure both growth and margins.
Rates
Higher real yields hurt long-duration growth stocks. A hawkish Fed can extend the correction even if the fundamentals stay strong.
Nvidia Stock Key Levels
Buy Zone: 177–190
The lower channel line and horizontal support at 177. This is the area to build a position.
Confirmation: Weekly Close Above 194
Reclaiming the 63-week EMA signals that wave 4 is complete.
Targets: 212 → 228.8 → 243 → 270–280
The 13-week EMA, then the 228.8 resistance, then the record high, then the upper channel line as the wave 5 target.
Warning: Weekly Close Below 177
Points to a deeper wave 4 inside the channel.
Invalidation: Weekly Close Below 152
A close below the 2024 highs breaks the structure, and the count goes under review.
Nvidia Stock Summary
Update, Nov 13 (NVDA near 163):
⚠️ The 177–190 buy zone failed after the CEO resignation. Watch the weekly close: above 177 = repair, below 152 = bull count under review
Original setup, Nov 7 (NVDA at 186.64):
🟢 Buy zone 177–190 at channel support. Confirmation above 194. Targets 212, 228.8, 243 and 270–280
⚠️ A weekly close below 177 means a deeper wave 4
🔴 Invalidated on a weekly close below 152
Nvidia’s chart is at support, its earnings are at record highs and its multiple is at a multi-year low. When the technical picture and the valuation point the same way, the risk-reward is on the buyer’s side.
Run your own Nvidia valuation with Stock Dashboard Pro
Only €19 / month · cancel anytime
11 years of SEC fundamentals, a valuation model where you set revenue growth, margin, share count and exit P/E to get a target price and annualized return, and an AI analysis of Nvidia’s moat, growth and risks. It works for any US stock and takes under a minute.
Chart and Summary are free to try at impulsealpha.com/stocks-dashboard
—
Disclaimer: ImpulseAlpha is an independent software tool and is NOT a broker, financial advisor, or associated with any asset management corporation. This analysis is for educational purposes only and does not constitute financial, investment or trading advice. Trading involves significant risk.
