


Know what a stock is worth before you buy it
11 years of SEC fundamentals, a valuation model with your own assumptions, and an AI analysis of moat, growth and risk. Any US stock, in under a minute.
Chart and Summary are free to try at impulsealpha.com/stocks-dashboard
Three tools that answer one question: is it worth the price?
Most investors buy on headlines and sell on fear. The Stock Dashboard gives you the numbers a professional analyst looks at, without a Bloomberg subscription.
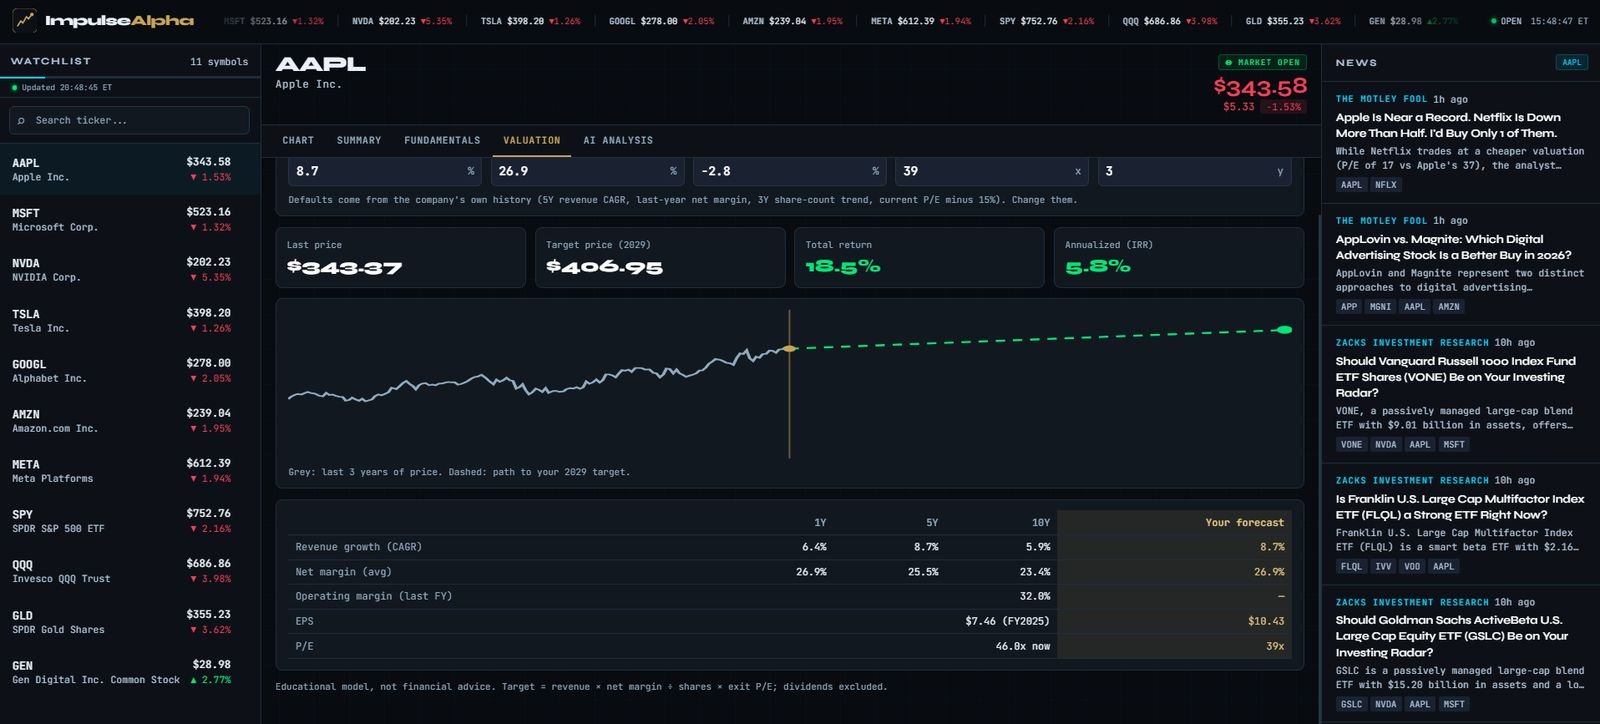
11 years of real numbers, straight from SEC filings
- Revenue, operating margin, net income, EPS and free cash flow, year by year
- Revenue CAGR over 1, 3, 5 and 10 years
- Buybacks and dividends: is the company shrinking its share count or diluting you?
- Growth phase at a glance: hypergrowth, steady, mature or declining
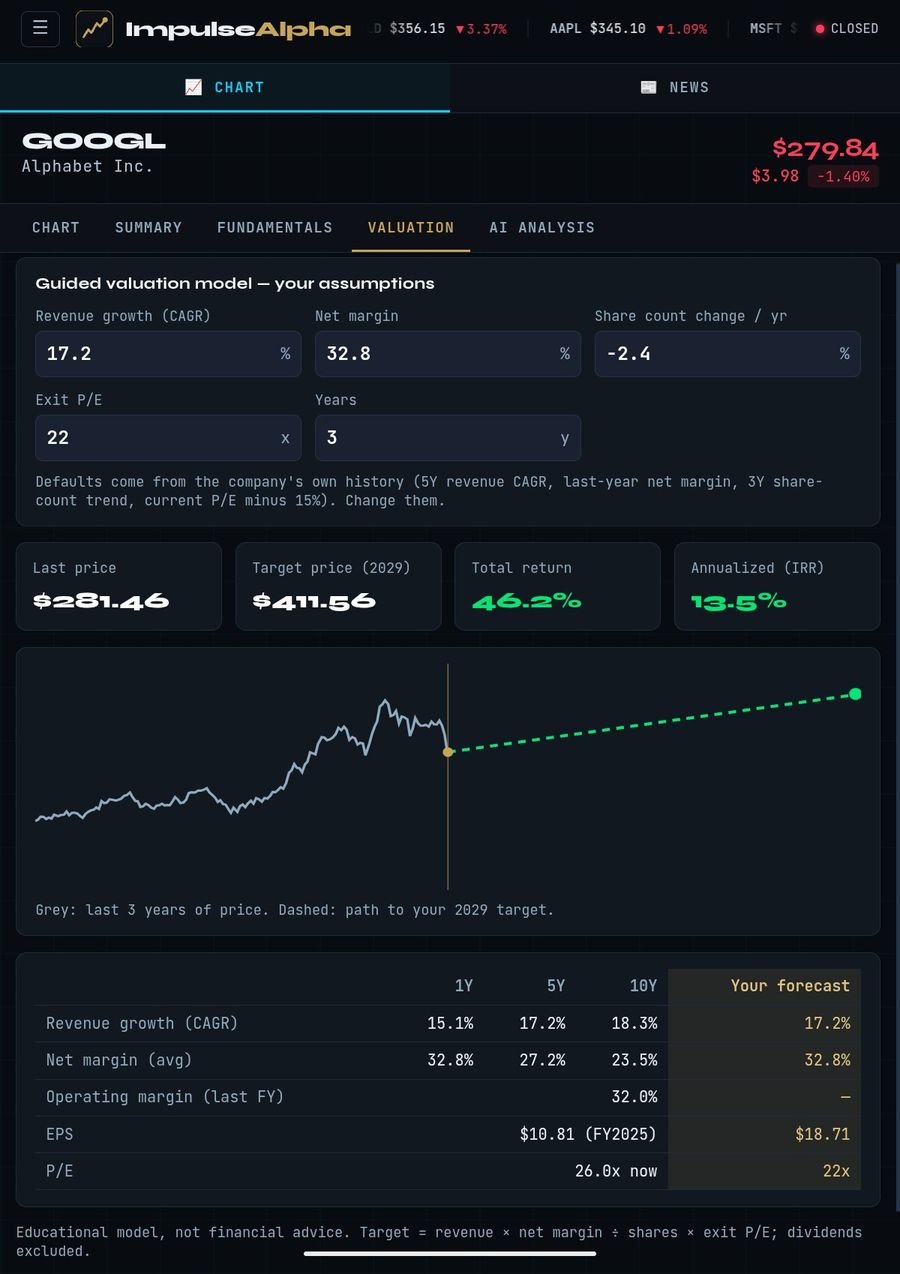
Your assumptions. Your target price. Your return.
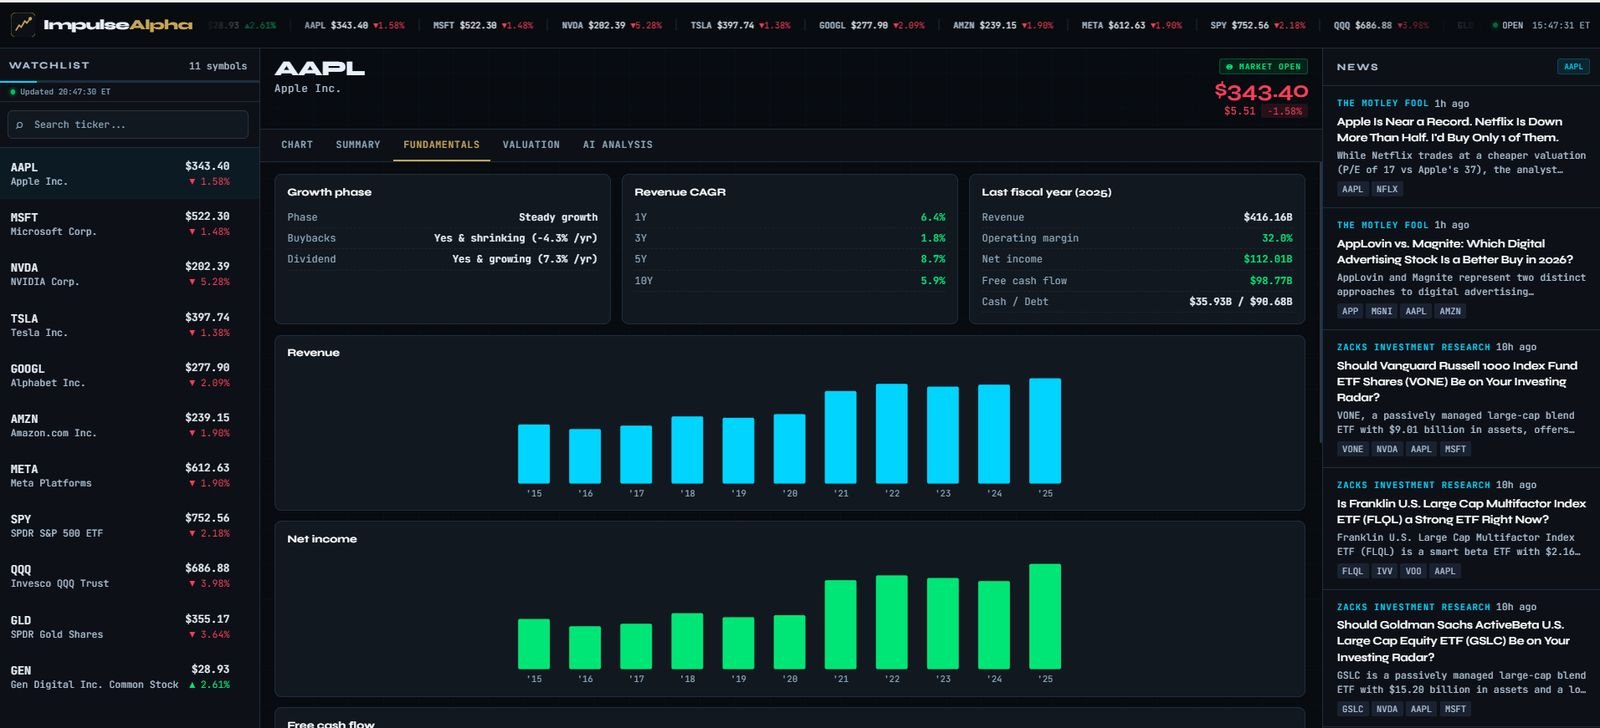
- Set revenue growth, net margin, share count change and exit P/E
- Get the target price, total return and annualized return (IRR) instantly
- Defaults come from the company’s own history, so you start from facts, not hype
- See history next to your forecast and spot when your assumptions are too optimistic
The qualitative side, scored 1 to 5
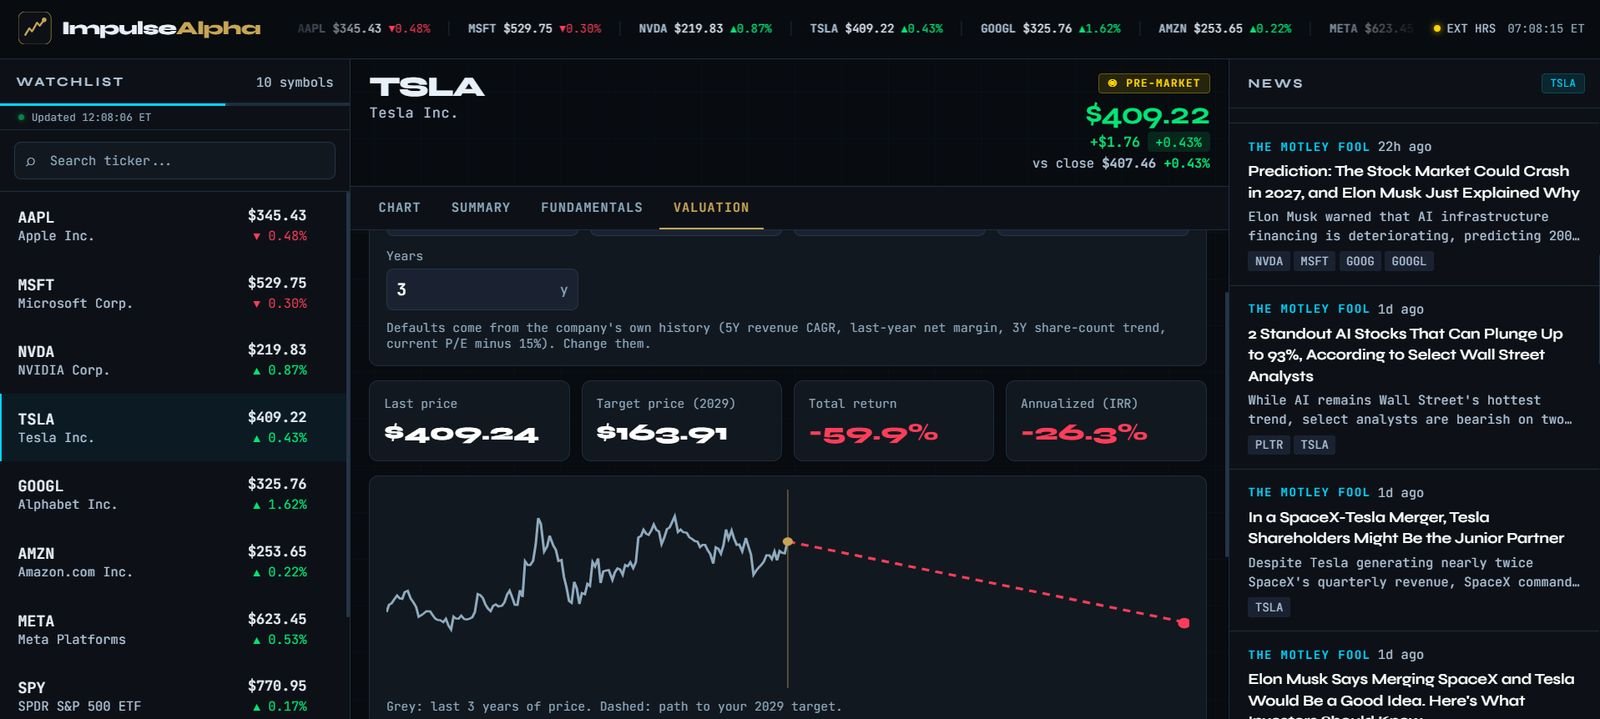
- Business: customers, pricing power, predictability, recession resistance
- Moat: size, direction and sources of competitive advantage
- Growth, management and capital allocation, and the key risks
- “What to watch”: the concrete items to monitor next quarter
What the model showed this month
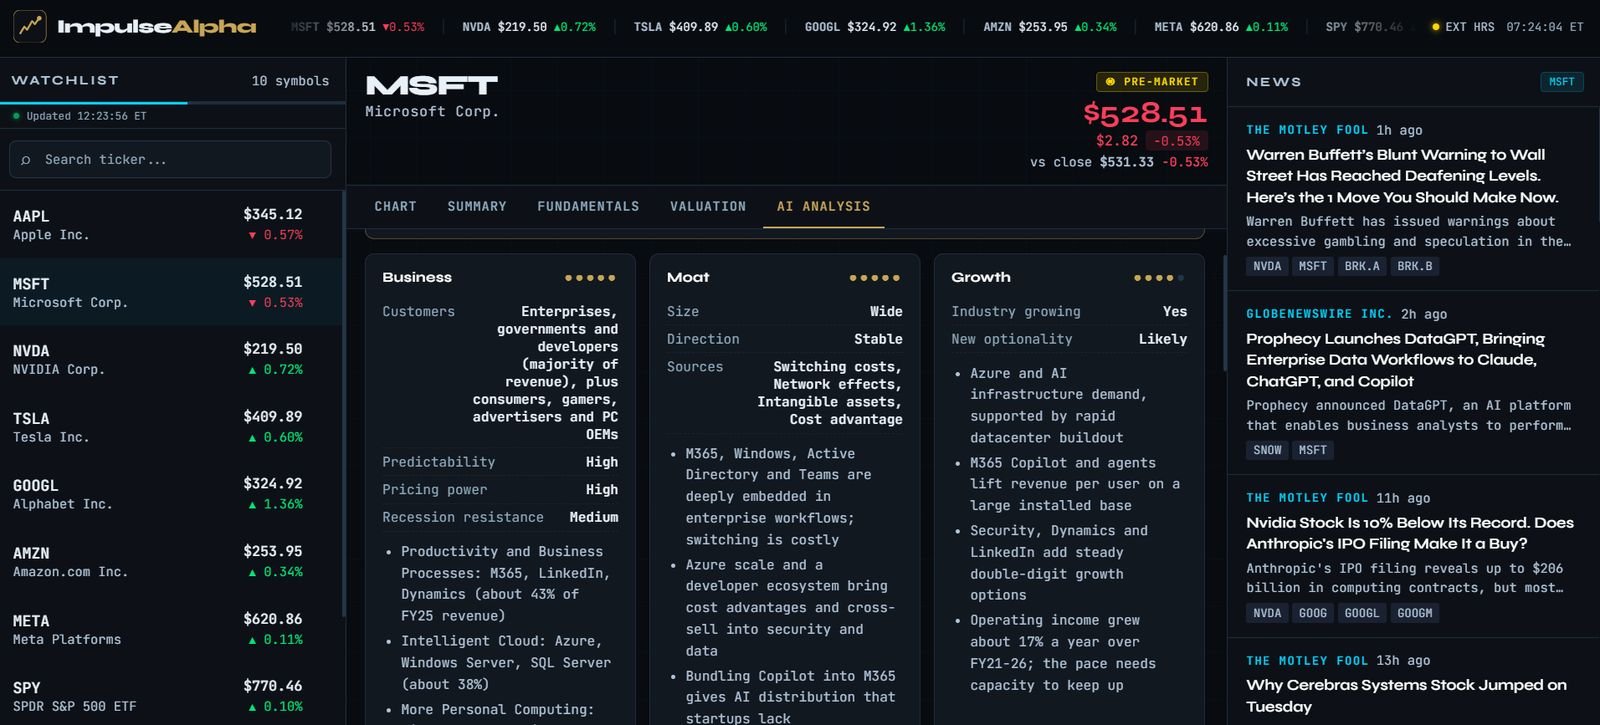
Same tool, three very different answers. That is the point: it tells you when a great company is a bad buy.
After the selloff, even at a lower 22x P/E, earnings growth carries the return.
Elite business, but at today’s multiple most of the upside is already priced in.
Even with generous assumptions, the numbers don’t support the current price.
Educational model outputs based on each company’s historical data. Not a recommendation.
Works on your phone, too
Check a valuation before you place the order, straight from your phone. Live prices, watchlist and news are in the same screen.
Choose your plan
Investing in stocks? Stock Dashboard Pro is all you need. Actively trading gold, indices and futures? Go All-Access.
INVESTORS
Stock Dashboard Pro
- ✓ Fundamentals: 11 years of SEC data
- ✓ Valuation model with target price and IRR
- ✓ AI analysis: business, moat, growth, risk
- ✓ Live chart, watchlist and news
- — Elliott Wave and ICT scanners
- — Terminal, research library, signals
ImpulseAlpha All-Access
- ✓ Everything in Stock Dashboard Pro
- ✓ Elliott Wave and ICT scanners
- ✓ ImpulseAlpha Terminal
- ✓ Institutional research library
- ✓ Telegram signals and WhatsApp alerts
- ✓ Annual plan €399 (save 52%)
Questions
Which stocks are covered?
Any US-listed company that files 10-K reports with the SEC. ETFs and foreign ADRs have the chart and summary, but no fundamentals.
Where does the data come from?
Fundamentals come directly from SEC EDGAR 10-K filings, adjusted for stock splits. Prices and company profiles come from a professional market data feed.
How do I get access after I pay?
Right after checkout you get your personal access link on the member page. Open it once and the Pro tabs unlock on that device.
Can I cancel?
Yes, anytime, with no penalties. Access stays active until the end of the period you paid for.
Is this investment advice?
No. ImpulseAlpha is an independent software tool. The model shows what your assumptions imply; the decision is always yours.
Start Stock Dashboard Pro: €19/month
Pay by card or PayPal
Cancel anytime. Chart and Summary stay free forever.
Prefer crypto? BTC · ETH · USDT · XRP and 300+ coins
Secure checkout via NOWPayments. After payment, your access link is sent to you.
ImpulseAlpha is an independent software tool and is NOT a broker, financial advisor, or associated with any asset management corporation. All outputs are educational and do not constitute investment advice.