

For our current gold and silver setups, read the Gold Bearish Setup and the SLV Forecast.
Fundamental overview
-
Gold prices are surging: Gold has recently broken above ~$4,900/oz, hitting fresh highs on strong demand and lower odds of near-term rate rises.
-
Copper near multi-year highs: Copper futures climbed sharply — around 5.95 USD/lb with strong weekly gains amid tight fundamentals.
-
Metals including gold, silver and copper are displaying a broad commodities rally, with record or near-record prices, as investors rotate into hard assets.
🟡 Gold Market Drivers
-
Safe-haven demand and expectations of a softer Fed policy are helping gold in particular.
-
Producers benefit from elevated prices — e.g., Freeport-McMoRan reported strong earnings thanks to high realized copper and gold prices, even with production disruptions in Indonesia, supporting margins.
🔴 Copper – Structural Tightness + Strategic Demand
-
Copper has surged due to robust demand from EVs, renewables, and data centers and constrained supply growth.
-
Reports suggest looming deficits and rising consumption may underpin continuing bullish pressure.
-
Major tech companies are locking in copper supply — e.g., AWS signed a deal with Rio Tinto for U.S. mined copper for data infrastructure build-out.
-
Projects like Pebble Mine in Alaska are gaining attention as potential supply solutions amid tight markets.
📉 Corporate & Production News
-
Lundin Mining cut its 2026 guidance for both gold and copper, leading to a significant share drop — a notable supply story alert.
-
Junior explorers are reporting new copper-gold discoveries and drilling results (e.g., Torr Metals in BC), highlighting ongoing exploration interest.
-
Ongoing drilling and development news from several mining companies shows sustained activity in both metals.
Gold parabolic January
Gold has hit almost 5000 level set by some of the biggest banks as a target for 2026 by some of the biggest banks. It has gone above 200% Fibonacci extension from 2001 low and above 300% extension from 2015 low. These are levels that are dangerous for buying as we did not have a substantial correction from 4400 high. Buying mania is reaching the highest levels so we are at the intermediate top.

On the daily chart we see a short-term channel high and a price much above the upper Bollinger band ever in history. Psychological level has been reached and I see this as a turning point short-term. Break below 4900 will expose 4880 level of support for a possible second attack on 5000. Long trade entries at this point have a greater risk then short trades.

Copper rejected from 6.000
Copper is not following Gold and Silver higher as it has been rejected by the 6.1400 (join to get premium analysis, weekly and mid-week newsletter and other tools for for your successful trading) and has showed the lack of the upside momentum. Long-term upside support is 4.8800 and a break below 5.6000 will expose this level of LT support test.
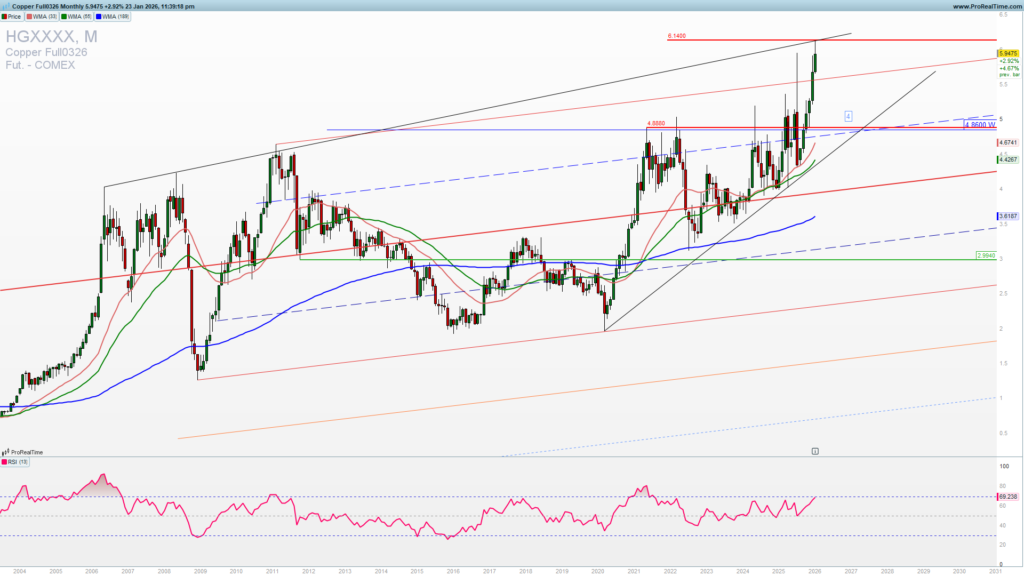
Friday bounce does not look so convincing and we do need more confirmation that the uptrend will continue. Long trades are preferred on a clear break and close above 6.2000. Short trade entries have better risk to reward at this point to target below 5.000.
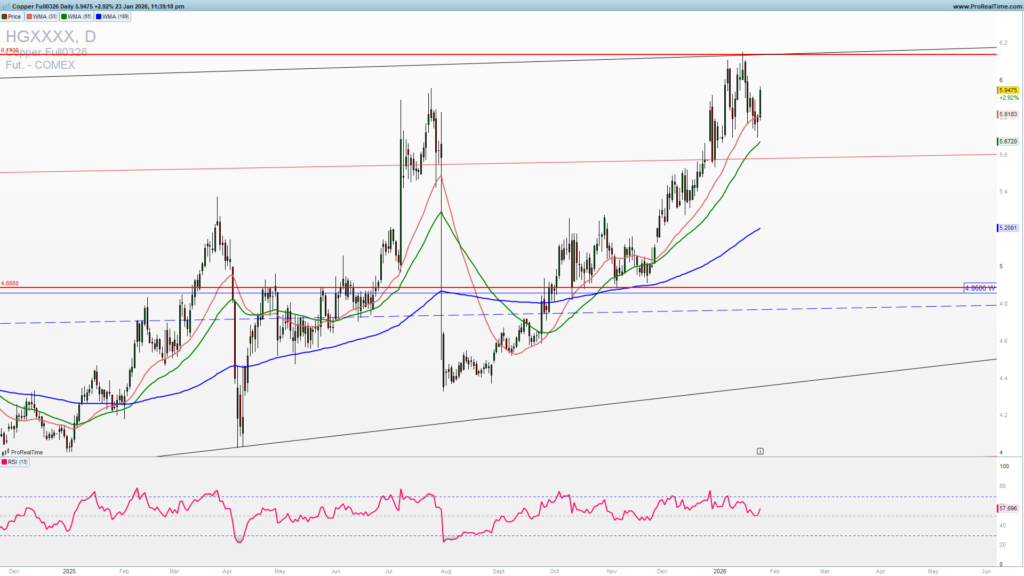
Below 5.000 a zone 4.8000-5.0000 is for the long-term uptrend extension buying.
Trade safe!