

Update, November 19: beat and raise, stock still fell
Revenue $115.8B vs ~$109B expected, EPS $2.68 vs $2.47, Q4 guide ~$130B vs ~$125B. NVDA popped after hours, then closed Wednesday at 150.96, below the 152 line. Read our post-earnings analysis →
Nvidia earnings arrive on Tuesday, November 17, after the close, only five days after Jensen Huang resigned as CEO. NVDA closed the week at 162.85, down about 30% from its record high. Interim CEO and CFO Colette Kress will post written commentary when the results go out, followed by a 5 p.m. ET call.
Until Friday: get All-Access Annual and a free $5,000 FTMO Instant account. Valuation model, full research library and the new Options Probability Screen, where the options market prices NVDA at Friday’s expiry.
This is the first report without Huang at the helm, so the market is asking one question: did the business change, or only the leadership? Below are the three numbers that will answer it, and the levels that tell you how the stock is taking the news.
Free before earnings: our full NVDA research report. Data center growth, margins, the CUDA moat, valuation vs. consensus and the bull vs. bear case.
Nvidia Earnings: What the Street Expects
| Metric | Q3 FY2027 consensus | Q2 FY2027 actual |
|---|---|---|
| Revenue | ~$108.8B | $96.22B |
| EPS (diluted) | ~$2.47 | $2.22 |
| Report date | Tue, Nov 17, after the close · call 5 p.m. ET | |
Nvidia’s own August guidance pointed to revenue of about $108 billion, so consensus sits just above the company’s number. In Q2, Nvidia beat both revenue and EPS estimates. Sources: Nvidia investor relations and MarketBeat consensus as reported by financial media.
3 Critical Numbers in This Nvidia Earnings Report
1. Q4 revenue guidance
The quarter itself is mostly known. The guide is what moves the stock. A Q4 outlook clearly above the Q3 print says hyperscaler demand has not slowed. A flat guide, in the first report after a CEO exit, would be read as the business losing its pace.
2. Gross margin
Nvidia’s pricing power is the core of the bull case. A stable margin means customers still pay up for GPUs, networking and CUDA. A drop would feed the bear story of rising competition from custom chips.
3. What Kress says about leadership and continuity
Watch for the succession timeline, any change in product roadmap, and comments on export licenses and China. Calm, specific answers can take the leadership discount out of the stock quickly.
Nvidia Stock Key Levels Into Earnings
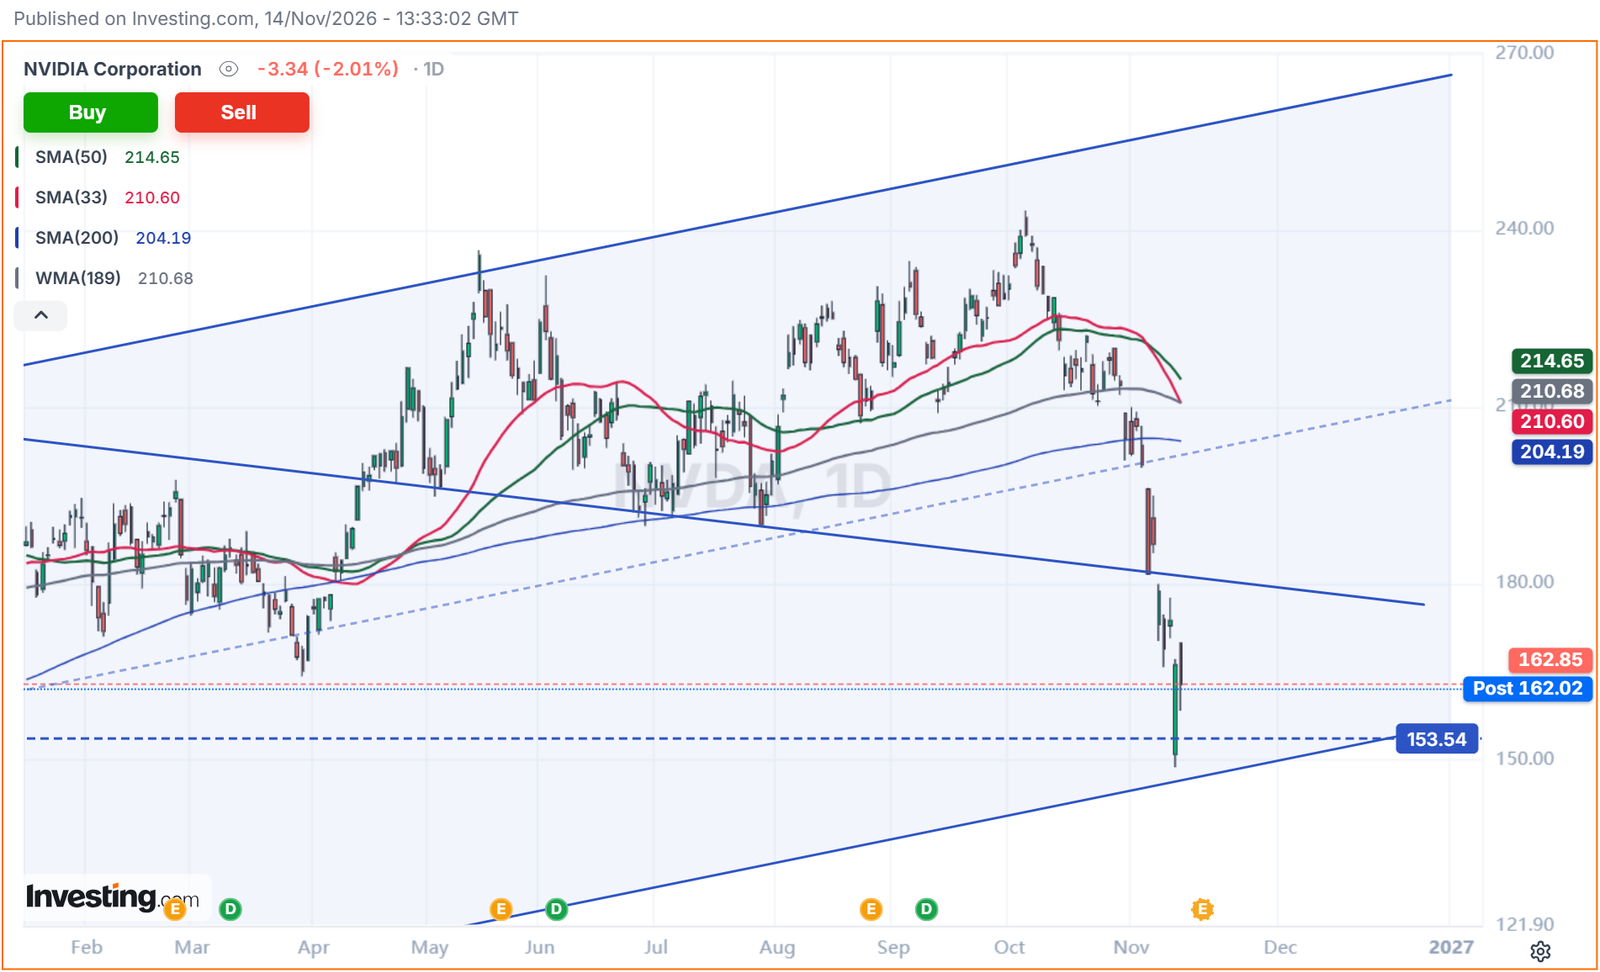
Resistance: 177
The old 2025–2026 support, broken last week. A daily close back above it after earnings would be the first sign of repair.
Support: 152
The 2024 highs and the line for the long-term bull count. NVDA dipped below it intraday after the resignation but closed the week well above it.
Low: 148.80
The post-resignation low. A break below it after earnings would open a deeper correction.
Nvidia Earnings Scenarios
Beat and raise
Revenue above consensus, a strong Q4 guide and stable margins. A move back above 177 becomes likely, with the 63-week EMA near 194 as the next test.
In line
Numbers meet expectations, but leadership questions linger. Expect a range between 152 and 177 while the market waits for a permanent CEO.
Miss or weak guide
The leadership discount turns into a fundamental one. A weekly close below 152 would put the long-term bull count under review.
Nvidia Earnings Summary
NVDA at 162.85 into the Nov 17 report:
🟢 A close above 177 after earnings = repair, next test near 194
⚠️ 152–177 = range while leadership questions play out
🔴 A weekly close below 152 = long-term count under review
What the ImpulseAlpha Dashboard Says About Nvidia
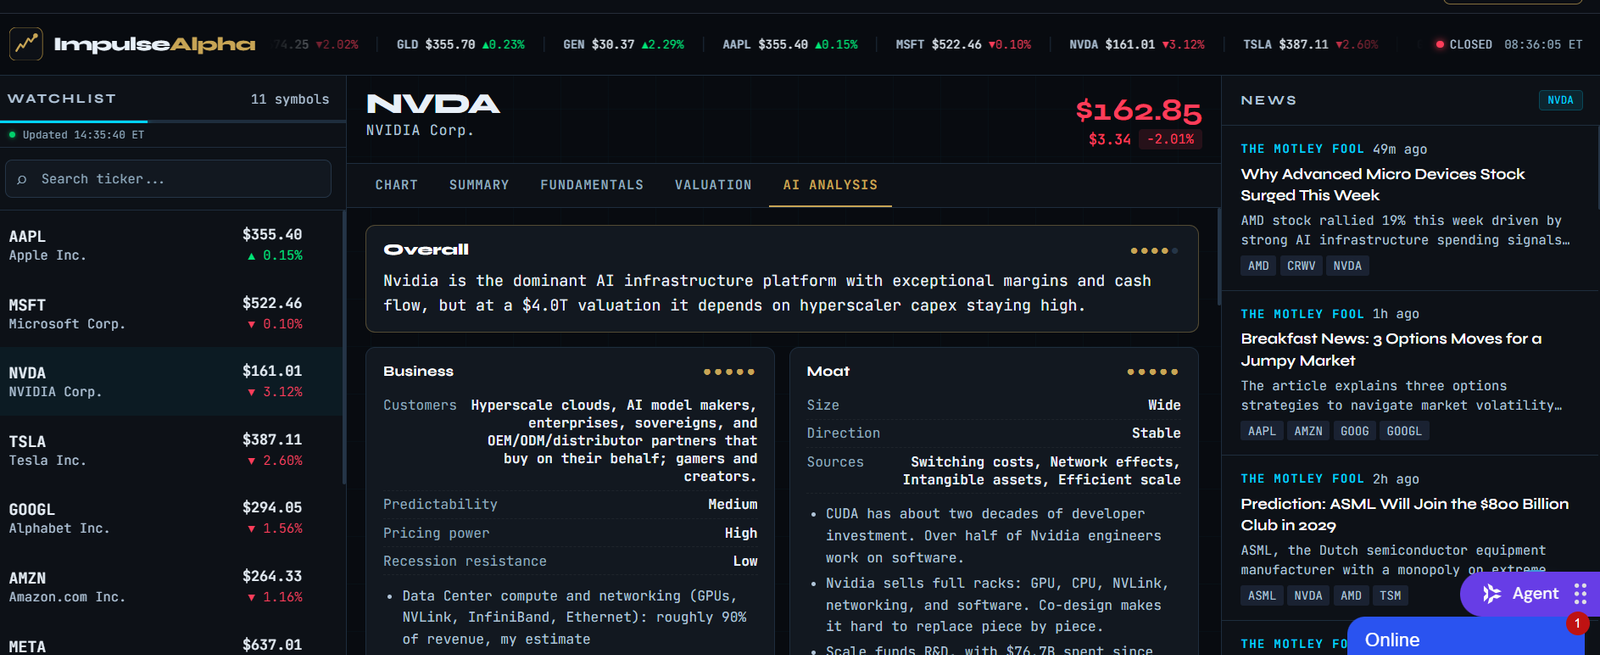
Our AI analysis rates Nvidia’s moat as wide and stable, built on switching costs, network effects and two decades of CUDA investment, with high pricing power. The catch: at a roughly $4.0T valuation, the stock depends on hyperscaler capex staying high, which is exactly what Tuesday’s guide will test.
Until Friday, November 20: All-Access Annual comes with a free $5,000 FTMO Instant account. The valuation model, the full research library, the new Options Probability Screen (where the options market prices NVDA at Friday’s expiry) and the Elliott Wave and ICT scanners for €399 a year. One per member. ImpulseAlpha is not affiliated with FTMO.
Value Nvidia yourself before the report
Stock Dashboard Pro · €19 / month
Plug in your own growth, margin and exit multiple and see what NVDA is worth by 2029, backed by 11 years of SEC data. Or get the full research library with ImpulseAlpha All-Access.
Chart and summary are free at impulsealpha.com/stocks-dashboard
—
Disclaimer: ImpulseAlpha is an independent software tool and is NOT a broker, financial advisor, or associated with any asset management corporation. This analysis is for educational purposes only and does not constitute financial, investment or trading advice. Trading involves significant risk.