

Tesla stock closed Wednesday at 390.84, up about 9% in three sessions and back at the 50-week moving average. The rally is strong, but the numbers underneath it are not: third-quarter revenue was flat at $28.05 billion and the operating margin was just 2.6%.
ImpulseAlpha research rates TSLA Hold with a 12-month target of 300, about 23% below the current price. The chart is constructive, the valuation is not. We would turn more positive on a weekly close above 400, and the downside case opens on a weekly close below 343.
Check Tesla’s numbers yourself: live chart, SEC fundamentals and a valuation model with your own assumptions.
Tesla Stock Rating at a Glance
| Rating | Hold |
| 12-month target | 300 |
| Last close (Nov 11) | 390.84 |
| Downside to target | ~23% |
| Upgrade trigger | Weekly close above 400 |
| Downside trigger | Weekly close below 343 |
Tesla Stock Chart: Testing the 50-Week SMA
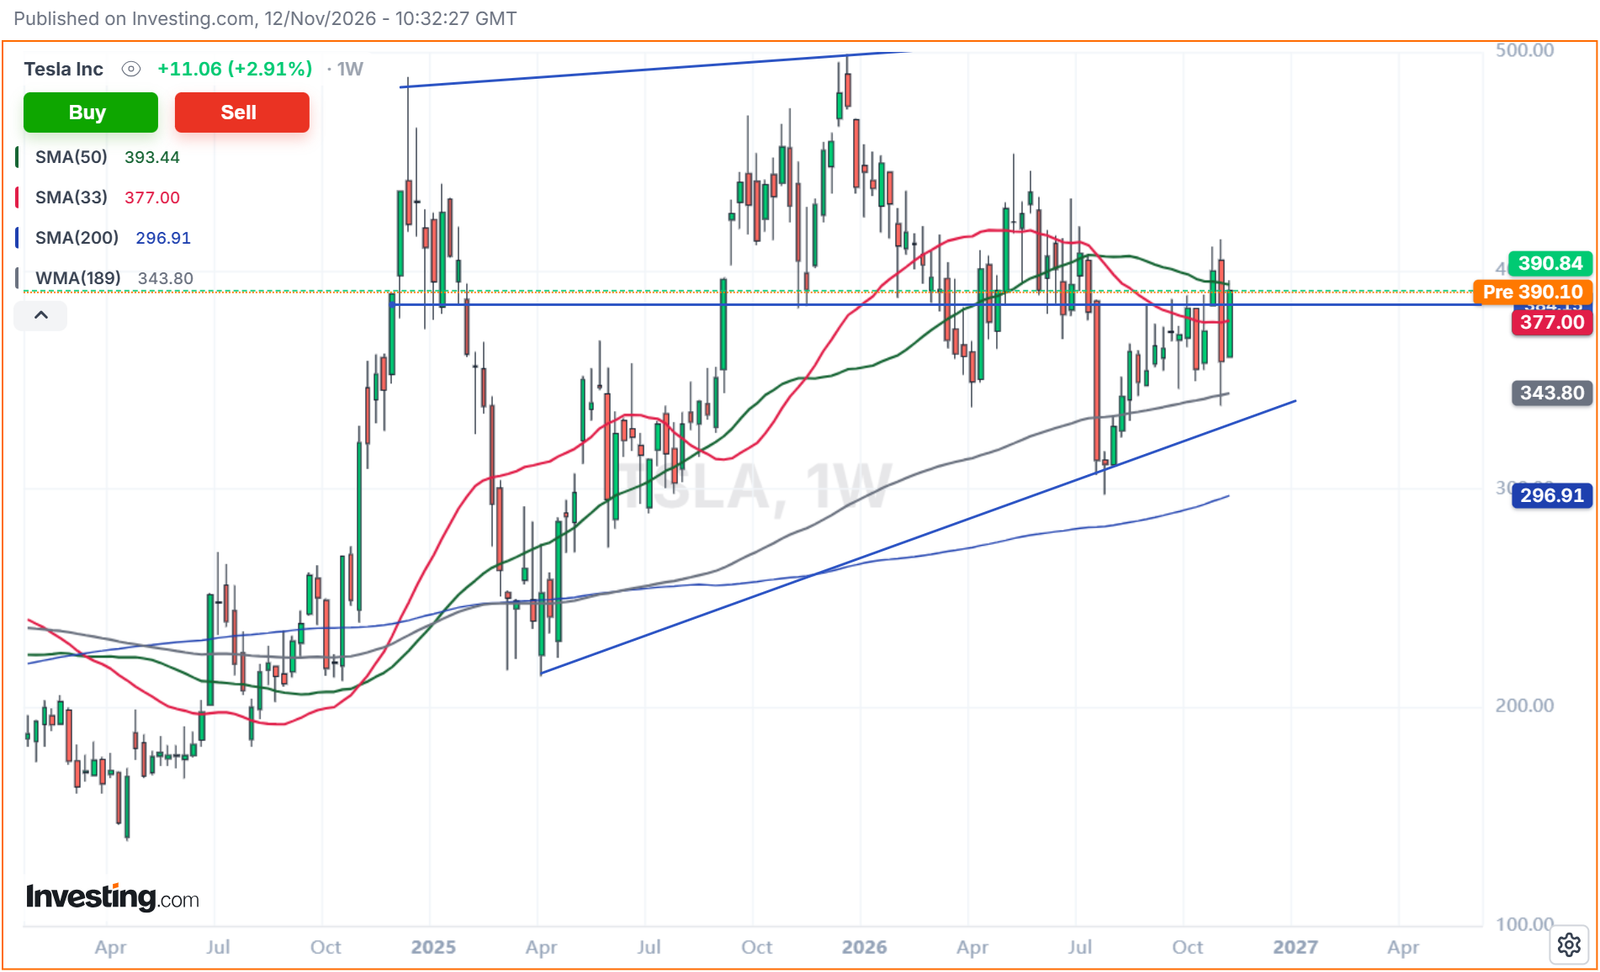
Since the April 2025 low, TSLA has made higher lows along a rising trendline, which the July 2026 low near 300 confirmed. This week the stock reclaimed the 33-week SMA (377) and is now pushing into the 50-week SMA at 393, right where the 2025–2026 horizontal pivot sits.
The structure is a wide range: rising support below, the 498.80 record high above. A weekly close above 400 would put the upper half of that range back in play. A close below the 189-week WMA at 344 would hand control back to sellers.
Tesla Fundamentals: Q3 2026 in Numbers
| Metric | Q3 2026 |
|---|---|
| Revenue | $28.05B (flat YoY) |
| Gross margin | 19.6% (18.0% a year ago) |
| Auto gross margin ex credits | 18.1% (16.3% in Q2) |
| Operating margin | 2.6% (5.8% a year ago) |
| GAAP net income | $787M (−43% YoY) |
| Free cash flow | $1.53B |
| Cash and investments | $45.4B |
The annual trend explains the Hold:
| Fiscal year | Revenue | Operating income | Diluted EPS |
|---|---|---|---|
| FY2023 | $96.8B | $8.9B | $4.30 |
| FY2024 | $97.7B | $7.7B | $2.04 |
| FY2025 | $94.8B | $4.4B | $1.08 |
Source: Tesla 10-K filings and the Q3 2026 results.
Why Hold: 3 Reasons
1. Earnings have fallen three years in a row
Revenue has been flat since 2023 while diluted EPS dropped from 4.30 to 1.08. At 390, the stock trades at roughly 250x this year’s consensus EPS of about 1.55.
2. The price is paying for autonomy, not cars
Margins in the core business did improve in Q3, and FSD is now attached to more than 75% of North American deliveries. But operating expenses rose 39% on AI, Optimus and Cybercab spending. The car and energy businesses alone do not support today’s valuation.
3. Why not Sell
The balance sheet is strong, with $45.4B in cash, the chart is in a rising range, and autonomy headlines can move the stock far past fundamentals in either direction. That makes a short or a Sell rating a poor risk-reward, even with the target below the price.
The Risks to Our View
Upside Risk
Faster Robotaxi expansion or a clear FSD revenue line could justify a much higher multiple.
Downside Risk
Another quarter of falling operating income, EV price competition, and a capital spending plan that keeps rising could push the stock back to the rising trendline near 320–330.
Tesla Stock Key Levels
Resistance: 393–400
The 50-week SMA and the horizontal pivot.
Support: 377, then 344
The 33-week SMA and the 189-week WMA.
Trendline: 320–330
Rising support from the 2025 and 2026 lows.
Target: 300
The July 2026 low and our fair value range.
Tesla Stock Summary
TSLA at 390.84:
🟢 A weekly close above 400 reopens the upper range toward 450–500
⚠️ Hold, 12-month target 300, while the stock trades between 344 and 400
🔴 A weekly close below 344 points to the trendline and the 300 target
Get the full Tesla research report
ImpulseAlpha All-Access · €69 / month or €399 / year
The TSLA report covers the income statement, balance sheet, automotive and energy KPIs, the latest earnings call, how the 300 target is derived, and the bull vs. bear case. It sits in the research library next to NVDA, CRWV, AMD, MU, PLTR and more.
Get All-Access and the Research Library →
Only need the valuation model? Stock Dashboard Pro is €19/month →
—
Disclaimer: ImpulseAlpha is an independent software tool and is NOT a broker, financial advisor, or associated with any asset management corporation. This analysis is for educational purposes only and does not constitute financial, investment or trading advice. Trading involves significant risk.