


For context, also read our previous outlook, Gold and Nasdaq Outlook: 3 Critical Levels Before a Powerful Fed Test, and our earlier call, Gold Support Holds.
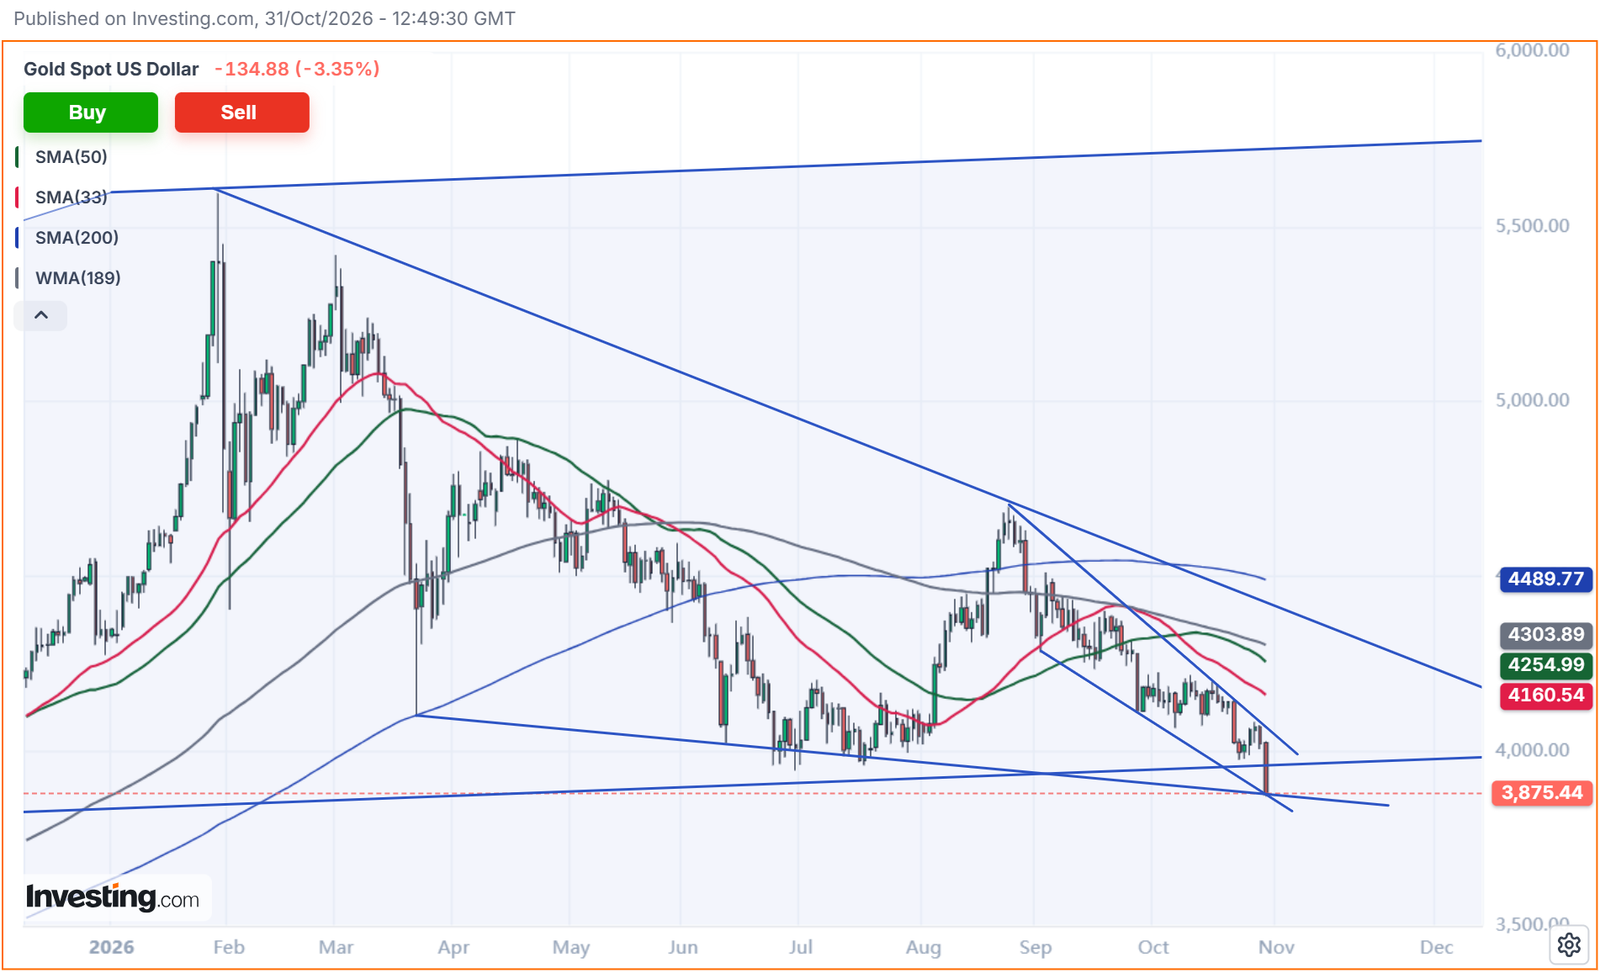
The gold falling wedge that has defined the entire 2026 correction is now being tested at its lower boundary. XAUUSD fell 3.35% on Friday to close at $3,875, a one-year low and roughly 30% below the January peak near $5,580. The move broke the $3,941 year-to-date low, but it ran straight into the support line that has contained every major low since March.
That is the setup this analysis is about. A falling wedge is a pattern of lower highs and lower lows that converge, and it typically resolves upward. Price is now at the point where the wedge either holds and turns, or fails. Our read: this test is a buying opportunity with a clearly defined invalidation level below.
Update, November 7: the wedge support held. Gold bounced about 4–5% from the $3,875 low and is trading around $4,050, back above the broken $3,941 level. Confirmation 1 has triggered, and the next target is the 33-day SMA near $4,160.
Playing gold through stocks? Gold miners move with leverage to the metal. Check whether they are still cheap with 11 years of SEC fundamentals and a valuation model.
Gold Falling Wedge: What the Chart Shows
The Wedge
The upper line connects the late-January peak near $5,580 with the late-August high near $4,700. It now runs through the $4,300–$4,350 zone. The lower line connects the March low near $4,100 with the June and July lows near $3,950–$3,990, and it now sits at roughly $3,860–$3,880. Friday’s close at $3,875 is right on it.
Two Supports in One Place
The decline from the August high has its own falling channel. The lower line of that channel meets the lower line of the large wedge at the same price, around $3,870. When two independent structures converge on one level, that level carries more weight than either line on its own.
The Long-Term Rising Support
A long rising trendline runs just above, at roughly $3,950–$3,980. Friday’s drop closed below it. Reclaiming that line is the first sign that the breakdown was a final flush rather than the start of a new leg lower.
Elliott Wave Read
In Elliott terms, a falling wedge at the end of a correction is an ending diagonal: the last, overlapping C wave that exhausts the sellers before the larger trend resumes. The break of $3,941 means the correction from $5,580 is deeper and longer than our earlier count assumed, but the structure still fits a wave 4 that is finishing inside a diagonal. Wave 5 targets would come back into play on a confirmed breakout from the wedge.
Moving Averages Mark the Path
All four averages sit above the price and slope down: the 33-day SMA at $4,160, the 50-day SMA at $4,255, the 189-day WMA at $4,304 and the 200-day SMA at $4,490. They are resistance today, but they also mark the steps of a recovery. The 189-day WMA sits in the same zone as the upper wedge line, which makes $4,300 the key breakout level.
Why Gold Fell: Rates, Not a Broken Thesis
Hike Bets and Hot Inflation
The Fed held rates at 3.75%–4.00% this week, but markets are pricing a possible hike in December. September PCE inflation came in at 0.5% month-on-month and 3.6% year-on-year, and Q3 GDP beat expectations. Higher real yields raise the opportunity cost of holding a metal that pays no interest, and that is the direct channel behind Friday’s selloff.
Forced Selling
Speculative selling and ETF outflows amplified the move. A drop of more than 3% in a single session at a one-year low is what capitulation usually looks like.
The Bigger Picture Has Not Changed
Standard Chartered’s Suki Cooper flagged $3,886 as the level gold must hold, while expecting a recovery as the focus shifts back to de-dollarization and currency debasement. A Reuters poll of 30 analysts still has median forecasts of $4,495 for 2026 and $4,650 for 2027, according to The Currency Analytics. The risk is real: JPMorgan Private Bank expects hikes in December and early 2027 and sees more downside until rates peak. That is why the setup below has a hard stop.
Gold Key Levels: Buy Zone, Triggers and Targets
Buy Zone: $3,850–$3,900
The lower wedge line and the channel bottom converge here. This is the area to build a position, not to chase a breakout later.
Confirmation 1: Daily Close Above $3,941
Reclaiming the broken 2026 low turns the breakdown into a false break, and those often reverse sharply.
Confirmation 2: Daily Close Above $4,000–$4,050
That is the upper line of the short-term channel. A close above it ends the decline from the August high.
Targets: $4,160 → $4,255 → $4,300–$4,350 → $4,490
The 33-day SMA, then the 50-day SMA, then the upper wedge line together with the 189-day WMA, then the 200-day SMA. A daily close above $4,350 confirms the wedge breakout.
Invalidation: Daily Close Below $3,800
A close below $3,800 puts price clearly outside the wedge. The pattern fails there, and the next support is the $3,600–$3,700 area.
Follow-Up on Our Previous Calls
October 27 Outlook (gold near $4,010)
The bullish trigger, a close above $4,040, fired on October 27 at $4,062, but the follow-through failed and the $4,075–$4,100 target was not reached. The bearish trigger, a close below $3,975, fired on October 30 and the $3,941 and $3,890 targets were hit. We said a break of $3,941 would put the wave 4 count under review. It has been reviewed: the correction is extending into the wedge described above.
Gold Falling Wedge Summary
XAUUSD at $3,875:
🟢 Buy zone $3,850–$3,900 at the wedge support. Confirmation above $3,941, then $4,050. Targets $4,160, $4,255, $4,300–$4,350 and $4,490
⚠️ Below $3,850, price is testing the setup and needs to recover quickly
🔴 Invalidated on a daily close below $3,800, which opens $3,600–$3,700
Gold has corrected 30% in nine months, and the whole decline has been contained by one pattern. Price now sits on the bottom of that pattern after a capitulation-style drop. The reward from here is a move back toward $4,300 and beyond. The risk is defined by a single level, $3,800. That asymmetry is what makes this a buying opportunity rather than a falling knife.
Get the full gold wave count with ImpulseAlpha All-Access
Monthly €69 · Annual €399 (save 52%)
Elliott Wave and ICT scanners, the ImpulseAlpha Terminal, the Stock Dashboard with valuation and AI analysis, the research library and Telegram signals. One plan, everything included.
30-day money-back guarantee, no questions asked
—
Disclaimer: ImpulseAlpha is an independent software tool and is NOT a broker, financial advisor, or associated with any asset management corporation. This analysis is for educational purposes only and does not constitute financial, investment or trading advice. Trading involves significant risk.
