

For context, also read our previous daily analysis, Gold and Nasdaq Outlook: 3 Critical Levels Before a Powerful Fed Test, and our chip sector study, SOX Index: 3 Proven Supports in a Bullish Triangle.
This gold price analysis opens the morning after a hawkish Fed hold. Spot gold trades near $4,050 after a three-day rebound stalled just under $4,075. The Nasdaq 100 closed Wednesday near 29,750–29,810, but futures are down roughly 1%–1.6% overnight after Alphabet fell about 10% on an earnings miss. The one thing that matters most today: the 8:30 a.m. ET PCE and GDP releases, because markets already price a December rate hike and a hot print would push yields higher.
Gold Price Analysis: Structure and Elliott Wave Context
Elliott Wave Context
Our higher-timeframe count is unchanged. The January 2026 peak near $5,580 ended a large impulsive advance, and gold is still in a wave 4 correction. The $3,975 low from October 23 is labeled as the end of a C wave, and it held above the $3,941 year-to-date low. The rebound since then has three up days, but it stalled below $4,142, the last swing high. Until price clears that level, we treat the rally as a corrective bounce, not a confirmed new impulse.
Price Action
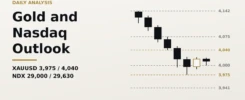
Gold closed Tuesday near $4,060, its first close above $4,040 in a week. On Wednesday it dipped to about $4,035 after the Fed decision, then recovered toward $4,057, according to Kitco. The rejection near $4,074–$4,080 is the key detail: buyers defended $4,035, but sellers held the top of the range.
Key Levels
Resistance: $4,075–$4,080, then $4,100–$4,120, then $4,142–$4,150. Support: $4,025–$4,035, then $4,000, then $3,975, with $3,930–$3,941 below.
Bullish Scenario
If gold closes above $4,080, the structure points to $4,100–$4,120, then $4,142–$4,150. A close above $4,150 would be the first sign that wave 4 may be complete. Invalidation: a daily close below $4,000.
Bearish Scenario
If gold closes below $4,000, the rebound likely fails and the C wave can extend toward $3,975, then $3,930–$3,941. Invalidation: a daily close back above $4,080. A break of $3,941 would put the wave 4 count itself under review.
Nasdaq 100: Earnings Gap Tests the Breakout
Elliott Wave Context
The Nasdaq 100 set a record near 31,365 in early October, then made a lower low near 28,850. That favours an A-B-C correction. This week’s rally reached the 29,800–29,850 zone, where a falling trendline and the 50-day average sit. That is classic wave B territory. A rejection from there keeps a wave C decline on the table.
Price Action
Wednesday’s high was near 29,849, just above resistance, before the close slipped back under it. Overnight, Alphabet’s miss and negative free cash flow outweighed a strong Microsoft report. Options pricing implied a move of roughly ±440 points for Thursday and Friday combined, so a wide range is likely.
Key Levels (cash NDX, approximate zones)
Resistance: 29,800–29,850, then 30,100–30,200. Support: 29,450, then 29,000, then 28,850–28,950, with 28,100–28,300 below.
Bullish Scenario
If the index closes back above 29,850, the structure points to 30,100–30,200, near the 200-day average. Invalidation: a daily close below 29,000.
Bearish Scenario
If the index closes below 29,000, the wave C decline likely targets 28,700, then 28,100–28,300. Invalidation: a daily close above 29,850.
Macro: Yields, Dollar, Fed Odds and the Calendar
Yields and the Dollar
The 10-year Treasury yield is near 5.0%–5.05%, edging up after the Fed. The dollar index is steady near 102.2, holding above 102.00. Brent crude near $114 keeps inflation risk alive, which works against both gold and long-duration tech.
Fed Pricing
The FOMC held at 3.75%–4.00% in a 10-2 vote, and two governors dissented in favour of an immediate hike. Futures pricing, as reported by Kitco and Mitrade, now shows about an 83% chance of a 25 bp hike in December.
Calendar
Today at 8:30 a.m. ET: Q3 GDP (about 3.2% expected), September PCE (headline about 3.6% y/y, core about 3.1% y/y) and jobless claims. The ECB decides at 2:15 p.m. CET. Amazon and Intel report after the close. Friday brings the BoJ decision.
Follow-Up on Previous Setups
Gold (October 27, published near $4,010): Bullish trigger fired, first target just missed
The trigger was a daily close above $4,040. Gold closed Tuesday near $4,060, so it fired. The first target, $4,075–$4,100, was not reached: the high was about $4,074, roughly a dollar short. The $3,975 invalidation was not touched, so the setup is still open, with today’s levels replacing the old ones. The bearish setup did not trigger.
Nasdaq 100 (October 27, published near 29,400): Bullish trigger fired, first target reached
The trigger was a daily close above 29,630. The index closed Wednesday between about 29,740 and 29,810, depending on the source, so it fired. The first target, 29,800, was reached intraday with a high near 29,849. The second target, 30,000–30,200, was not reached, and the overnight futures drop puts the remaining gain at risk. The 29,000 invalidation has not been touched. The bearish setup did not trigger.
Summary
XAUUSD near $4,050:
🟢 Bullish above $4,080, toward $4,100–$4,120 and then $4,150
⚠️ Neutral between $4,000 and $4,080
🔴 Bullish case invalidated below $4,000, opening $3,975 and then $3,930
Nasdaq 100 near 29,750 (cash close):
🟢 Bullish above 29,850, toward 30,100–30,200
⚠️ Neutral between 29,000 and 29,850
🔴 Bullish case invalidated below 29,000, opening 28,700 and then 28,100
Both markets are reacting to a hawkish Fed and data that land before the cash open. Gaps through levels are possible at 8:30 a.m. ET and again after Amazon reports. Treat these levels as probabilities, not certainties.
Full Elliott Wave counts and the ICT and Elliott Wave market scanner are available in ImpulseAlpha All-Access → impulsealpha.com/setup/
—
Disclaimer: ImpulseAlpha is an independent software tool and is NOT a broker, financial advisor, or associated with any asset management corporation. This analysis is for educational purposes only and does not constitute financial, investment or trading advice. Trading involves significant risk.