
ImpulseAlpha
  • Home
  • Features
  • Live trading results
  • Blog
  • Dashboard
  • ImpulseAlpha Terminal
  • Stocks Dashboard
  • Contact
February 28, 2026 by TraderNomad

Is SPX Consolidating Before a New High? Here’s What the Charts Are Telling Us

Is SPX Consolidating Before a New High? Here’s What the Charts Are Telling Us
February 28, 2026 by TraderNomad

For our current index outlook, read the Nasdaq 100 Forecast and Market Complacency Signals.

SPX calm before a storm 

The SPX briefly touched 7,000 in late January 2026 before a wave of profit-taking pulled it back into a tight range between 6,800 and 7,000. What looks like indecision on the surface may actually be something far more constructive. Institutional investors have continued buying dips while retail traders sell into rallies — a tug-of-war that’s keeping the index in consolidation. In this post, we’ll break down why this standoff may resolve to the upside, and what key levels to watch before the next all-time high.

If you’ve been watching the SPX  lately, you’ve probably noticed something: it’s going nowhere fast. No dramatic selloffs, no explosive breakouts — just a slow grind sideways. Frustrating? Maybe. But if history is any guide, this kind of consolidation is often exactly what a healthy bull market looks like before it makes its next big move.

Table of Contents

Toggle
  • SPX demand zone is holding
  • Distribution time is getting to an end 

SPX demand zone is holding

SPX is bouncing off the range support 6800. This is a key demand zone to hold for an upside extension and a possible new high. This is also a previously broken multi-month uptrend channel resistance which is now acting as a good support. For a substantial reversal lower we need to see a strong close below 6500.
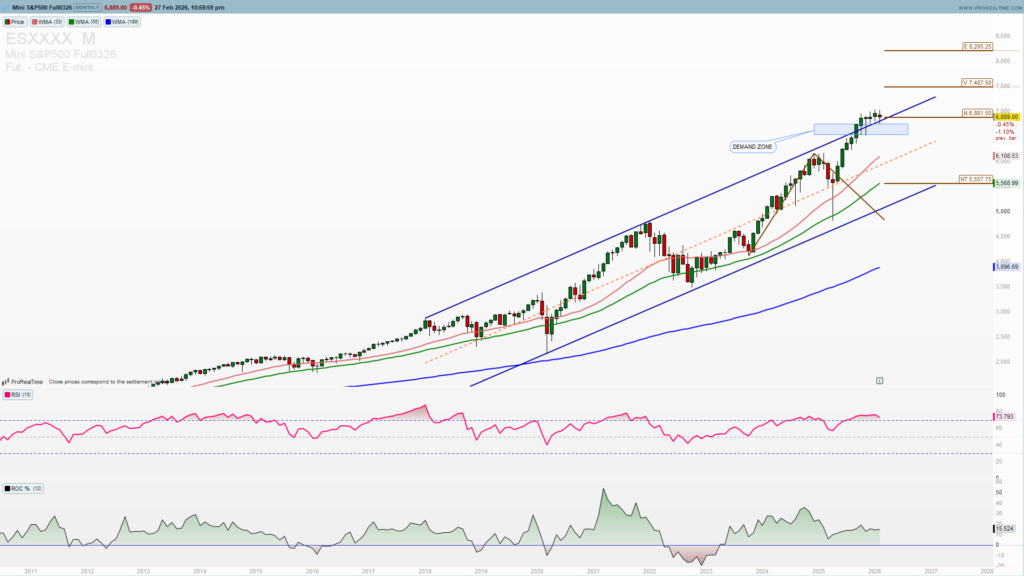
SPX monthly chart
SPX MONTHLY CHART


Distribution time is getting to an end 

Weekly chart reveals that support zone is 6700-6820 and any possible dip to this zone should be used for buying as I believe distribution consolidation time is coming to an end.
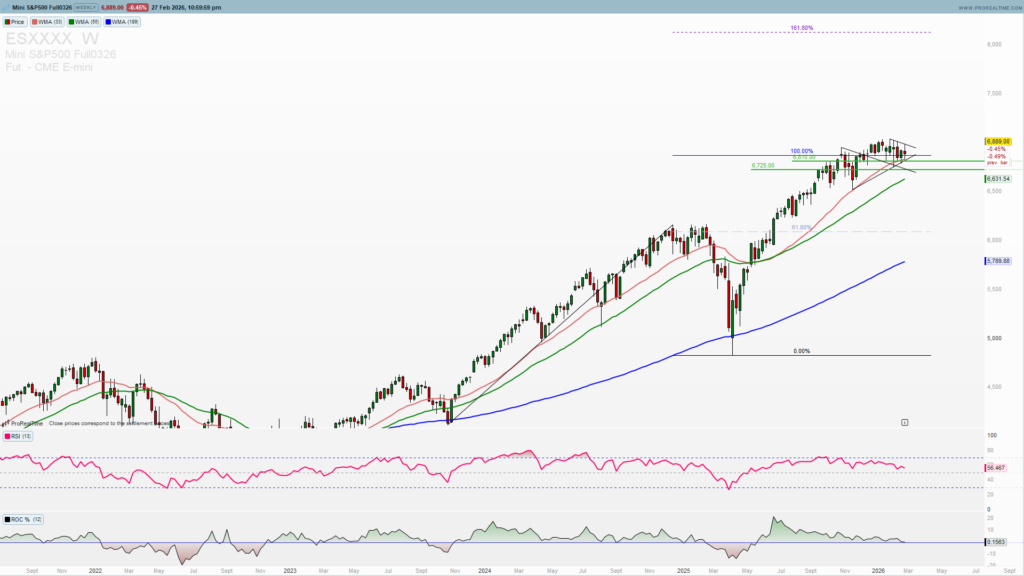
SPX weekly chart
SPX WEEKLY CHART

On this weekly chart you can see a possible bullish flag formed (join to get premium analysis, weekly and mid-week newsletter and other tools for for your successful trading ) above the support zone. A break above 6900 and a weekly close above this level is needed for an extension higher to 7000 and higher. Dips to support zone and especially 6700 should be used for buying.

Trade this setup with my preferred broker 👇

Open a Trading Account


On a daily chart it is visible that consolidation near the demand zone is supported with a lower highs and a pressure is rising with retail traders giving up from short trades and as they are exhausted form range trading. 
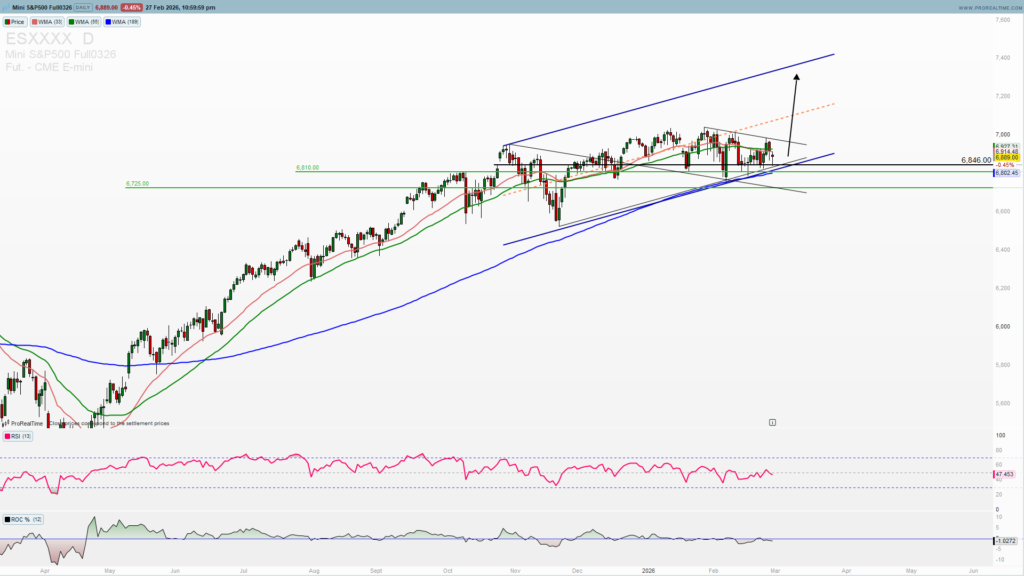
SPX daily chart
SPX DAILY CHART

Trading setup is perfect and I have been waiting for a long time for this to clear out and a squeeze to come to an end. This will lead to a strong explosive move 
 

Get Access to Trade Setups

Trade safe!


Previous articleInstant funded accountNext article Can AAPL Reach $300? Analysis & Forecast

Leave a Reply Cancel reply

Your email address will not be published. Required fields are marked *

Disclaimer

ImpulseAlpha is an independent software tool and is NOT a broker, financial advisor, or associated with any asset management corporation. Content is for educational purposes only and is not financial advice. Risk Disclaimer

Premium and free trade analysis articles

Recent Posts

Gold and Nasdaq Outlook: 3 Critical Levels Before a Powerful Fed TestOctober 27, 2026
SOX Index: 3 Proven Supports in a Strong Bullish Triangle Before New HighsOctober 24, 2026
Gold Price Analysis: 3 Critical Levels After a Brutal Nasdaq SelloffOctober 23, 2026

Categories

  • Trade analysis

Tags

August 2026 Bearish Setup Bitcoin Bitcoin Analysis 2026 Bitcoin Elliott Wave Bitcoin Price Prediction Bitcoin Sup BTC June 2026 BTC port Levels USD BTC Technical Analysis commodities Crude Oil Crude Oil June 2026 Elliott Wave Elliott Wave Oil Elliott Wave Signals equities GLD Analysis GLD ETF GLD Price Target GLD Technical Analysis gold Gold Buy the Dip Gold ETF 2026 ImpulseAlpha 2026 INTU Intuit July 2026 Nasdaq-100 NVDA NVIDIA Oil Price Forecast QQQ Rising Channel SPDR Gold Shares SPDR Gold Trust Stock Analysis Technical Analysis Trading Research Platform Trading Signals Review Weekly Chart WTI WTI Analysis WTI Technical Analysis XAUUSD

Why ImpulseAlpha

15+ years of trading experience — analysis built on real market knowledge, not theory.

Get Started Now!

Contact

support@impulsealpha.com

Recent Posts

Gold and Nasdaq Outlook: 3 Critical Levels Before a Powerful Fed TestOctober 27, 2026
SOX Index: 3 Proven Supports in a Strong Bullish Triangle Before New HighsOctober 24, 2026
Gold Price Analysis: 3 Critical Levels After a Brutal Nasdaq SelloffOctober 23, 2026
Impulsealpha Wordpress Theme. Proudly Built By Impulse
TOS and Privacy Policy
Disclaimer: ImpulseAlpha is an educational and analytical platform providing market software, scanners, and research tools. We are not a broker, do not handle client funds, and do not provide financial advice. ImpulseAlpha is completely independent and has no legal connections with any regulated or unregulated brokerage entities worldwide. Trading involves significant risk. Full Disclaimer available Risk Disclaimer

Recent Posts

Gold and Nasdaq Outlook: 3 Critical Levels Before a Powerful Fed TestOctober 27, 2026
SOX Index: 3 Proven Supports in a Strong Bullish Triangle Before New HighsOctober 24, 2026
Gold Price Analysis: 3 Critical Levels After a Brutal Nasdaq SelloffOctober 23, 2026